Unless otherwise noted, the data below is from the calendar year 2023 (January 2023 through December 2023).
Client Communities

9,725
Individual Accounts

61%
Students
33%
Faculty/Staff
6%
Other

2,345
Organizations

218
Courses

701
Trainees
OSC’s Impact

290.5 million+
cluster CPU core hours

1.8 million+
GPU hours

92%
jobs started within 30 minutes

99.6%
availability

26 PB
data stored on disk

3 PB
data transferred

1,667
software packages
Client Scholarship

1,102 publications

370 venues

7,672 citations
Client Annual Savings

$7.5+ million
Ohio Higher Ed
$1.5+ million
Non-academic

$24.6+ million
value of currently operative equipment
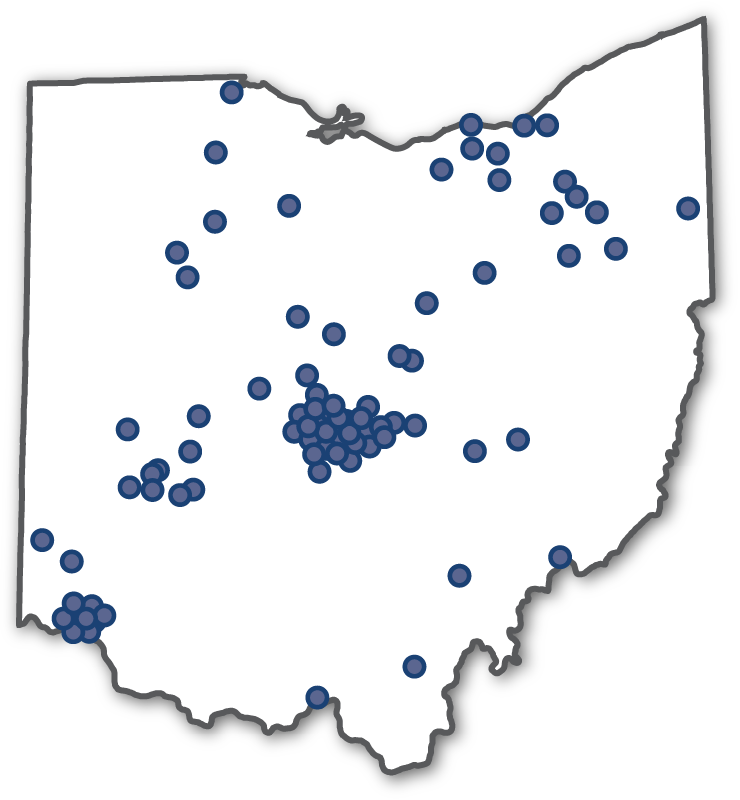
136 Ohio Organizations
65 academic, 38 industrial, 24 nonprofit/government, 9 Open OnDemand.
Usage by Field of Science
45 total fields represented

*Usage by Field of Science Details
- Natural Sciences (58%)
- Chemical Sciences (23%)
- Biological Sciences (19%)
- Computer Sciences (6%)
- Physical Sciences (5%)
- Environmental Sciences (3%)
- General (1%)
- Other (1%)
- Engineering and Tech (37%)
- Materials Engineering (8%)
- Mechanical Engineering (8%)
- General (7%)
- Environmental Engineering (7%)
- Other (5%)
- Medical Engineering (1%)
- Electrical Engineering (1%)
- Civil Engineering (1%)
- Medical and Health Sciences (3%)
- Social Sciences (2%)
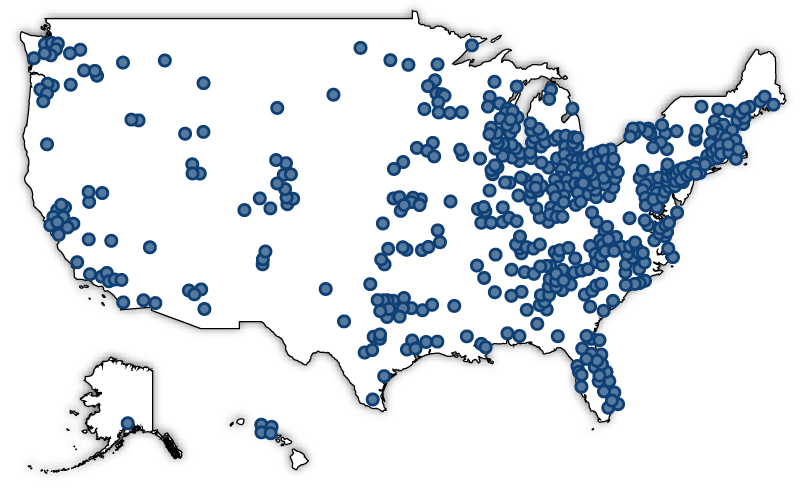
Individual Account Locations
50 states + Washington D.C. + Puerto Rico
Open OnDemand Sites
95 countries, 1,646 organizations

Overall System Usage in millions of core hours*

*Overall System Usage Details
- Total Time
- Combined Total (535 M)
- Systems
- Ascend (20 M)
- Owens (260 M)
- Pitzer (255 M)
- Type of Usage
- Client Usage (289 M)
- Commercial (31 M)
- Other Ohio Academic (36 M)
- Ohio State University (220 M)
- Non-Profit/Government (2 M)
- Other Usage (246 M)
- Downtimes (2 M)
- Unscheduled (53 M)
- OSC Internal (4 M)
- Available (187 M)
*Core hours: The total number of processor cores used times the hours they are used to complete a job.