YSI Project: Ohio's Watersheds

Become familiar with watersheds and their characteristics and learn about the importance of biological stream quality monitoring in the land use planning process.
Introduction
What you can do with this site
Learn about watersheds
Everyone lives in a watershed. A watershed is the area of land that drains into one particular stream or lake. We depend on reliable water sources for drinking, bathing, cooking, recreation and as a necessary resource for agriculture and manufacturing. Yet many of these same activities and uses can harm the watershed by changing how the river flows, how often and where it floods, and how clean it is. At this site and related sites, you can explore how people's activities can harm the watershed and how these activities can be managed to avoid such harm.
Find out how watershed quality is measured
Water quality can be measured in many ways. Here, you can explore what those measures are and what they can tell you about the water quality.
Look at what can be done to protect watersheds
It is very important to minimize the impact of development on watersheds. We can help maintain and protect the quality of watersheds by using best management practices (BMPs). You can learn about BMPs here and find out which are best suited for particular situations.
What is a watershed?
Characteristics of Watersheds
 |
A watershed is an area of land that forms the drainage system for a stream or river.
This area collects surface water from land within specific topographic boundaries (such as hills, valleys, mountains, and other landscape characteristics). |
Watersheds are characterized by the location of the pour-point, or mouth, of the main flow of water to which all the other points of flow join and eventually drain from the watershed. Some of the rainfall in the area of a watershed will flow on top of the ground or find its way via underground water paths to the stream in the watershed. Some of the water will evaporate into the atmosphere, be used by people or plants, or be held in the soil or underground. Watersheds are very dynamic places becoming alternately wet and dry, due to high water and low rainfall conditions, with many differences in quality and flow depending upon the season, the year, and even with what happens during an individual storm. This is best illustrated by examining the components of the hydrologic cycle. Click here to learn more about the hydrologic cycle.
Within a watershed, activities on the land interact with the natural hydrologic cycle. Important nutrients and chemicals are circulated throughout the watershed's system and supply a basic nutritional source for both aquatic (fish, aquatic insects, etc.) and terrestrial (birds, small mammals, etc.) species. People also use these environments to grow food, build their homes and businesses, and travel from one place to another. Where and how these human activities occur have major impacts on the movement of water, water quality, and the quality of the natural habitat which remains. Ideally, we wish to have watersheds that continue to function as healthy ecosystems and serve as productive systems for people.
Many different attributes are needed to maintain a high quality, biotically rich, functioning watershed. Healthy watersheds provide stable habitats for both biological diversity and human recreational uses. These stable systems are capable of adapting to environmental changes over time and are good indicators of the quality of the surrounding habitat. The following characteristics are critical for a healthy watershed: (You can click on the pictures to see more details).
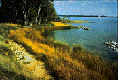
| Riparian Habitat & Protected Banks |  |
Riparian areas, areas along stream banks, are covered by transitional vegetation and act as buffers between a waterway and the surrounding area. These grasses, forbs, and trees reduce bank erosion by anchoring the soil. These buffer areas also function as a wildlife corridor and enable safer and more efficient wildlife migrations. |
| Good Water Quality |  |
Good watersheds usually function best with low turbidity, minimal suspended sediment in the water, and infrequent shifts in water levels. Frequency and intensity of fluctuating water levels are also very important considerations. |
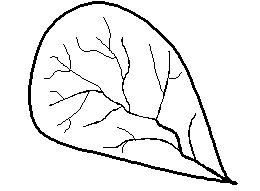
| Adequate Shade |  |
A riparian canopy provides structure and shade, which decreases the amount of penetrable sunlight. This decrease results in less extreme temperature gradients of the surface and sub-surface water. Cooler water can hold more oxygen for aquatic species to use. |
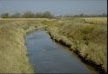
| Meanders | 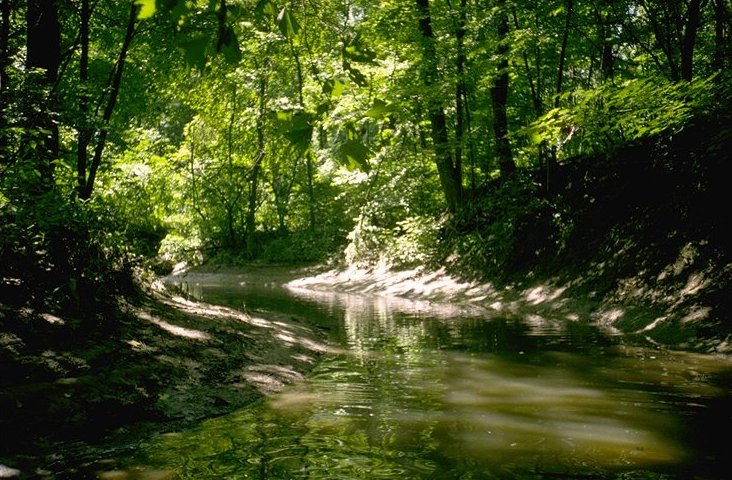 |
Meanders in a river are turns in the banks that result in a winding course for the waterway. These meanders slow the water down and allow for deposition of sediment and other suspended material on their banks. As healthy rivers and streams age, they will naturally form more meanders. |
| Biological Diversity |  |
Biodiversity is extremely valuable to both the natural order of the system and human recreation and non-consumptive uses. Different types of internal habitat and structure diversity, such as pool and riffle sequences and vegetation, also help to diversify the system and provide for increased stability. |
For more information on watersheds, visit these websites:
Adequate Shade
A riparian canopy provides structure and shade, which decreases the amount of penetrable sunlight. This decrease results in less extreme temperature gradients of the surface and sub-surface water. Cooler water can hold more oxygen for aquatic species to use.
Diversity
Biodiversity is extremely valuable to both the natural order of the system and human recreation and non-consumptive uses. Different types of internal habitat and structure diversity, such as pool and riffle sequences and vegetation, also help to diversify the system and provide for increased stability.
Good Water Quality
Good watersheds usually function best with low turbidity, minimal suspended sediment in the water, and infrequent shifts in water levels. Frequency and intensity of fluctuating water levels are also very important considerations.
Good Watershed 1
Riparian areas, areas along stream banks, are covered by transitional vegetation and act as buffers between a waterway and the surrounding area.
Meanders
Meanders in a river are turns in the banks that result in a winding course for the waterway. These meanders slow the water down and allow for deposition of sediment and other suspended material on their banks. As healthy rivers and streams age, they will naturally form more meanders.
Sampling Water Quality
Sampling Watershed Quality
Measuring Watershed Quality
- Traditional Water Quality Indicators
- Index of Biotic Integrity
- Invertebrate Community Index
- Qualitative Habitat Evaluation Index
Traditionally stream and river quality assessments have been conducted based solely on chemical analysis to analyze the impact of land use change on water quality. While variables such as pH, dissolved oxygen, hardness and concentrations of metals, soluble chemicals, nutrients, and organics were typically measured, other extremely valuable information regarding biological species diversity and overall habitat quality was lacking.
More recently, scientists have recognized the need to incorporate this biological data in order to create a comprehensive investigation of watershed quality and response to change. This biological line of investigation is important because chemical assessments could not assess the effect of a particular pollutant after settling in the system, and could only accurately measure its short-term effects.
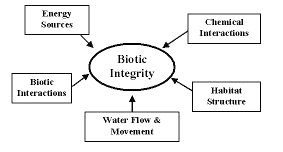
Biological methods take into account a variety of ecological indicators like topography, soil structure, water table levels, and surrounding vegetation and present a more conclusive picture of a watershed. These ecological variables are useful in measuring long-term effects and the ability of the water system to respond to major stress events. The Ohio EPA has highlighted the following as primary components of biological integrity:
 |
|
Using ecological parameters is extremely valuable in assessing non-point pollution. With no known discharge sites and unknown times of origin, non-point pollution becomes very difficult to assess. Therefore, it is in the best interest of the planner, developer, and landowner to recognize the need for incorporating biological data into watershed assessments.
- Biotic Integrity, according to Ohio EPA and watersystem scientists, is defined as the following:
- An aquatic ecosystem's ability to support and maintain a community of organisms with diversity, species composition, and functionality comparable to natural habitats within a similar region. This community should also be well-balanced, integrated throughout, and adaptable to changes over time.
Traditional Water Quality Indicators
Traditional Water Quality Indicators
Measuring chemical variables has been the traditional approach to water quality assessments. A few common chemical parameters for investigating water quality conditions are found below.
Common Chemical Water Quality Indicators
| Variable | Description | Example of Cause/Impact |
|---|---|---|
Available Oxygen |
The amount of molecular oxygen dissolved in water is an important measure of habitat availability for aquatic organisms. Low levels of oxygen result from the introduction of organic waste pollution which increases the rate of eutrophication and decreases the suitability for aquatic animal life. Sources include: agricultural runoff, urban runoff, and wastewater treatment plants. | 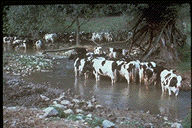 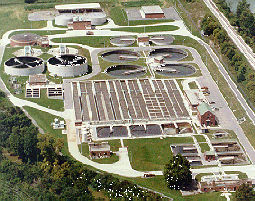 |
pH |
pH is a unit that expresses the strength of a solution based on its acidic or basic properties. Aquatic organisms can only function in a particular range of pH, and become forced to relocate when the surrounding water changes. Pollution from burning fossil fuels increases the amounts of sulfur and nitrogen oxides introduced into the water, thereby increasing the overall acidity. | 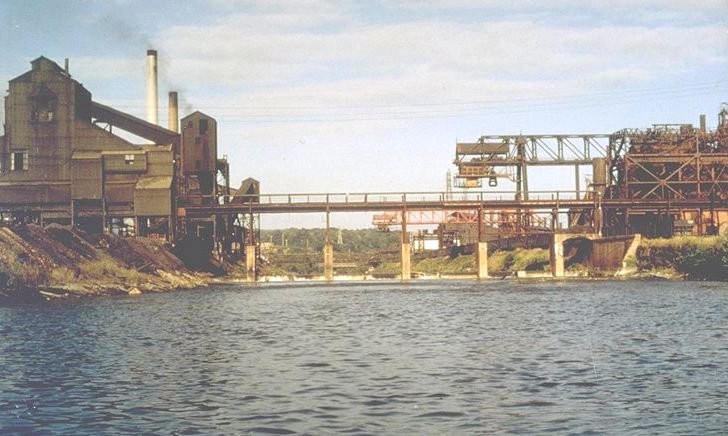 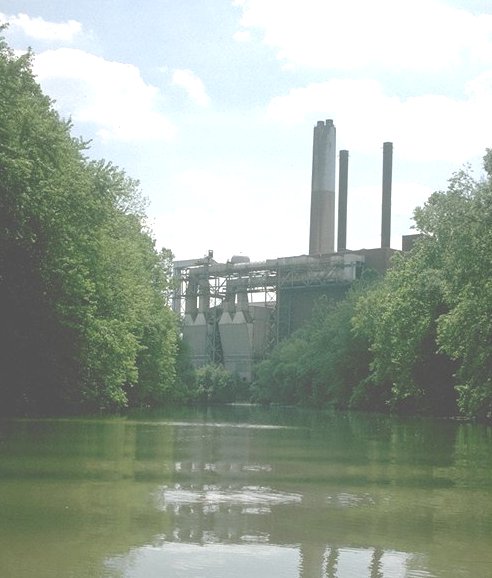 |
Turbidity |
The amount of suspended material in water can be measured by collecting the solids or assessing the relative light transmission of the suspension. The increased opaqueness is caused by increased sediment which negatively affect many aquatic organisms. Both algal production and fish reproduction and feeding can become diminished and some organisms, like shell-fish (continual filter-feeders) can become choked by sediment and eventually die in heavily turbid waters. | 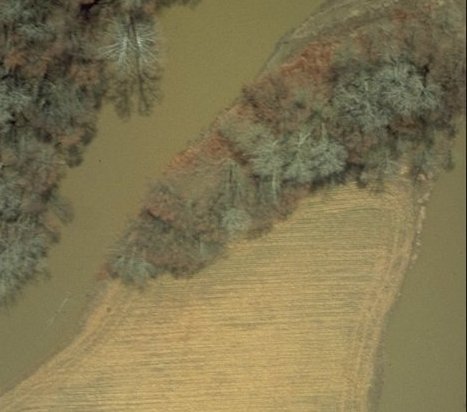 |
Toxic Organic Compounds |
There are many chemicals that have the capacity to travel throughout a waterway. Many of these are pollutants and can cause significant distress to the surrounding habitat. Solutions such as oil or antifreeze enter a watershed from nearby runoff sources and directly poison the surrounding aquatic environment. With appropriate riparian vegetation, large surge concentrations of these chemicals can be prevented from directly entering the water. | 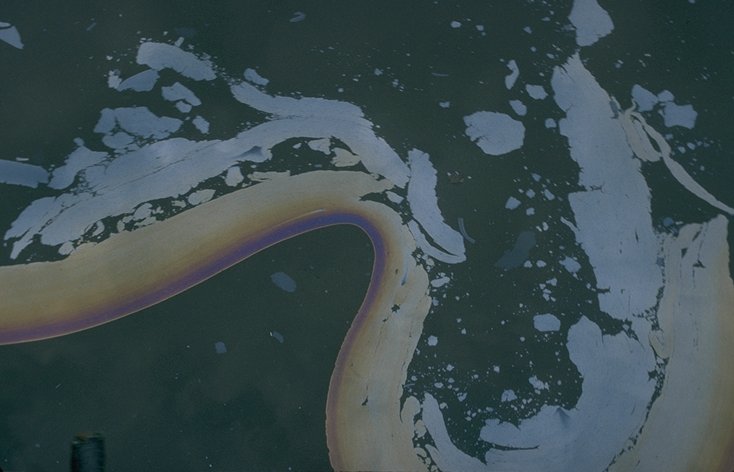 |
Heavy Metals |
Industrial effluents are major sources of heavy metals, and aquatic environments are extremely sensitive to even the smallest concentrations of these materials. Serious abnormalities have been reported in many aquatic organisms. Arsenic and mercury are two common examples of heavy metals, but other similar substances and compounds can also have significant effects on an aquatic community. |  |
Nutrients |
Additional nutrients, such as phosphorus and nitrogen, are added to streams by many avenues, but primarily through human sewage, animal waste, fertilizers and erosion. This area of water quality monitoring is greatly affected by both urban and agricultural human practices. Runoff from any inadequately covered lands can increase these nutrient loads and result in eutrophication of the nearby aquatic habitat. |  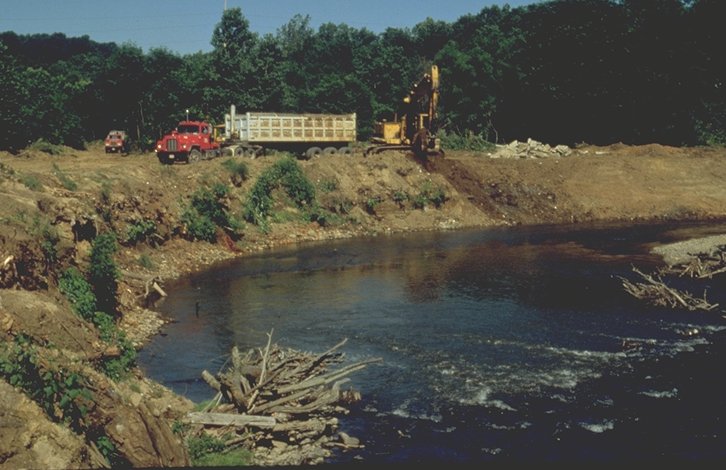 |
Although these chemical variables are useful to monitor impacts, they only provide a short-term picture of water quality at a sampled site and each can only represent a portion of a complete assessment. A couple disadvantages of using only chemical indicators include:
- Effects of certain isolated chemicals in a laboratory setting can be dramatically different than it's interactive effects with other variables
- Chemical testing is extremely expensive and labor intensive and not practical for monitoring non-point pollution sites such as urban and agricultural run-off
Chemical testing is much more applicable for point source pollution where industrial contamination is suspected.
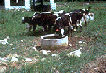
Agriculture
Animal waste, including manure and urinary waste can enter streams directly when livestock wade in and around the water. Animals also trample streambanks and damage fish habitat. Animal wastes deposited in waterbodies can accelerate eutrophication and contaminate water used for fishing, swimming, and drinking. Streambank fencing is one way to protect streams from this type of livestock damage (See best management practices).
Construction
Areas under construction are usually devoid of any surface vegetation and topsoil and remain bare for extended periods of time. This process allows for extremely high quantities of subsoil to runoff into surrounding stormwater systems where receiving waters eventually accumulate large sediment loads. This increase in sediment decreases the amount of light penetrating through the water and thereby decreases the diversity and productivity of aquatic organisms.
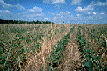
Farm Runoff
Crops planted on the edge of streams can create many problems with soil stability. With heavy farm machinery for planting and harvesting and heavy rainfall, increased soil compaction and bank erosion will result over time and the soil will be pushed into the stream thereby increasing sediment load and decreasing the area of the bank. Planting close to a stream edge should be avoided; area around the stream should be maintained with adequate trees and vegetation along the bank (See best management practices).
Metals
Measures of Toxic Metals in Water
Heavy Metals
Toxic metals can be present in industrial, municipal, and urban runoff, and by definition, are harmful to humans and aquatic biota. Increased urbanization and industrialization have increased the levels of trace metals, especially heavy metals, in water ways. There are over 50 elements that can be classified as heavy metals, but only 17 that are considered to be both very toxic and relatively accessible. Mercury, lead, arsenic, cadmium, selenium, copper, zinc, nickel, and chromium, however, should be given particular attention in terms of water pollution and runoff/discharge effects. Toxicity levels depend on the type of metal, it's biological role, and the type of organisms that are exposed to it.Availability of Heavy Metals
Toxic metals are often added to the streams as salts (sulfides, phosphates and carbonates), are very insoluble in hard waters and usually travel with sediment. The transformation into readily accessible materials (for organisms) is a complex process and depends on many factors such as pH, sediment presence, and hardness. The availability of these metals is determined by precipitation-dissolution reactions which are strongly affected by pH. Therefore, at a lower pH, metallic ions (heavy metals in general) are more available and more reactive. Many of these metals then undergo methylation, as a result of bioaccumulation where bacteria absorb these elements and convert them from a metallic state into a toxic organometallic state. By becoming incorporated with an organic component, these metals become readily available to the first trophic level of the food chain and eventually lead to biological magnification throughout the system.Testing Information
Since even low concentrations of heavy metals can cause serious harm to aquatic ecosystems, very sensitive and precise instruments are required to appropriately measure these substances in water samples. Technically speaking, a measure of the availability of heavy metals to the first trophic level of organisms can made by taking the fraction extracted by a hydroxylamine hydrochloride reagent or by a chelating cation exchange resin.
Nutrients
Measures of Nutrients in Water
Availability of Nitrogen
Nutrients are elements (or substances) that are necessary for plant growth. Both nitrogen and phosphorus are two such elements, but large amounts of these elements in water systems can become burdensome by promoting excessive aquatic algal growth. Prime nitrogen sources, eroded soils and sewage sludge, are found in suspended sediments and range from 0.02 to 10%. These concentrations can exist in a variety of forms: organic N (dissolved or particulate), ammonia (dissolved or adsorbed on sediments), nitrate and nitrite N, and dissolved nitrogen gas (N2). Available N is the fraction of the total N that can be readily assimilated by either macrophytes or phytoplankton.Availability of Phosphorus
Phosphorus is essential to all life, but is naturally scarce in most systems. This element is added to stream systems primarily as animal and human waste, detergents, fertilizers, and as a product of soil erosion. Phosphorus, found in two major forms, inorganic and organic, is readily removed from aquatic environments when fine-grained particles and organic phosphorus compounds settle in the water. Inorganic P (from fertilizers and detergents) can lead to an overload of nutrients, eutrophication. Organic P eventually breaks down into inorganic orthophosphates and becomes readily available to plants.Testing Information
There are many different laboratory techniques used to assess the quantity and type of nitrogen and phosphorus in water and sediment samples. These analyses are quite complex and require a knowledgeable technician and the ability to isolate the desired form of the investigated element.
Oxygen
Measures of Oxygen and Oxygen Demand
Dissolved Oxygen
Oxygen in water is available to the plants and animals that live there only if it is dissolved. Dissolved oxygen or DO can range in concentration from 0 to 14.6 parts per million in water. This is also equivalent to a weight-based measure, milligrams per liter (or mg/l). The amount of oxygen that can be dissolved in water is inversely related to temperature - that is as the water temperature gets higher, the amount of oxygen that can be dissolved in the water goes down. It is also possible under some circumstances to have oxygen levels above 14.6 mg/l. This can happen where water goes over a dam or other structure that causes unusual amounts of mixing. The more oxygen that is in the water, the more diversity can be expected in the plants and animals found in the water.
Pollutants that make DO go down (besides heat) are any organic wastes such as animal or human sewage or any chemicals that will be decomposed by bacteria in the water. The growing bacteria that break down either the organic or chemical wastes consume oxygen for their reproduction and thus take oxygen out of the water and away from the other plants and animals.
Biochemical Oxygen Demand (BOD)
BOD is a lab test that measures the total amount of oxygen per unit volume of water required to bacterially oxidize (stabilize or break-down) the organic matter in the water. Samples are incubated under standard conditions for periods of 5, 10, 20 or 30 days. The standard test is for 5 days. The higher the BOD, the more oxygen depletion will take place.
Chemical Oxygen Demand (COD)
A similar test which measures how much oxygen that the oxidation of chemicals in the water might use.
Testing Information
Tests for these variables can be biased by the presence of toxic chemicals which kill the bacteria that would break down the organic materials or oxidizable chemicals. When measuring DO, care must be taken not to introduce extra air from the atmosphere as the sample is taken. All samples must be tested immediately or else iced down and taken back to the lab for testing. The ice slows down any on-going chemical and biological reactions.
Runoff
<
|
Many pollutants enter nearby waterways by efficient movement across surfaces These surfaces do not allow for penetration and percolation which would normally occur in a well vegetated, open-soil area. Heavy concentrations of pollutants can enter a water system during storm events where a large amounts of water flow across impervious areas and flushes the compounds into the local river or stream. Pollutant levels from non-point sources can be decreased by supplying adequate vegetative ground cover throughout the riparian area (See best management practices).
Toxic Compounds
Measures of Toxic Organic Compounds
Availability of Organic Compounds
The focus of water quality attention in terms of toxic organic compounds is primarily given to manufactured organic chemicals applied to the surrounding land use as pesticides and herbicides (examples include DDT and PCBs). The availability of organic compounds to aquatic organisms in a water system is determined mainly by the rate of adsorption-desorption processes. These reactions can be affected by water quality factors including temperature, pH, and the presence/absence of other compounds. Concern should be given to the potential accumulation in the surrounding environment in terms of biomagnification of pesticides and PCBs - polychlorinated biphenyls.Testing Information
Different testing procedures are required to identify trace amounts of toxic organics such as chlorinated hydrocarbons which originate from agricultural runoff and industrial effluents. Special techniques for proper identification of oil residues in water is also necessary for a comprehensive analysis.
Turbidity
Measures of Turbidity in Water
Turbidity and Suspended Sediment
Sediment from nonpoint sources is the most widespread pollutant of surface water. Turbidity is the measure of the amount of suspended material in water and is determined by the relative light transmission of the suspension. Turbidity is an important consideration because it greatly reduces algal populations by inhibiting sunlight and slowing photosynthesis, changes heat radiation, has harmful effects on benthic fish and plants, and compromises most of water's major beneficial uses. The concentrations of suspended sediment in streams can be highly variable and are influenced by many factors, including the following: rainfall intensity and duration, soil condition, geology, topography, and present vegetation. Concentrations are measured in milligrams per liter (mg/l)
Testing Information
There are two typical scales used to measure turbidity, percent transmission and optical density. Percent transmission, or transmittance, varies from 0-100% and is based on the amount of light that is able to penetrate through the water sample. Optical density, or absorbance, is based on a logarithmic scale ranging from 2-0 where 2 represents the most turbid and 0 represents the least. A transmittance value of 50% corresponds to about a 0.3 absorbance value.
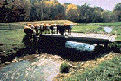
Waste Water Treatment
A wastewater treatment plant is where sewage goes from individual households and businesses. It removes a large percentage of the organic wastes (BOD) and sediments from the sewage and then discharges them into a local stream. Even so, the volume of the discharge can still cause a major pollution problem. You can find out more about what is in a wastewater sewage treatment plant at https://en.wikipedia.org/wiki/Sewage_treatment
pH
pH and Water Quality
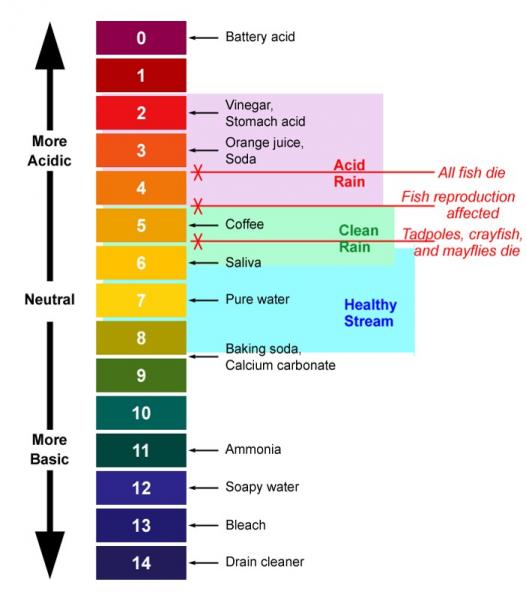
pH measures the acidity of the water. Thescale goes from 0 to 14 with 7 being neutral and numbers below 7 representing additional acidty and numbers above the lack of acid or "basic" conditions. Most organisms thrive in water that is near neutral.
As the amount of acidity increases, the impacts on aquatic life also increase. The acidity is toxic to aquatic life, contributes to the release of toxic metals into solution, and weakens the shells and skeletons of biota.
Major sources of acidity are industrial wastes and deposition of acids from air pollution (acid rain), The figure below shows some common items and their place on the pH scale. It also shows the levels at which various biota are impacted by acidity.
Index of Biotic Integrity
Index of Biotic Integrity (IBI)
This index is designed to measure the aquatic vertebrate community and the surrounding conditions by using fish species as indicators. Overall, there are 12 fish community variables that can be broken down into three main categories: species richness and composition, trophic composition, and fish abundance and condition. By assessing the variables within these parameters, scientists can compare a sampled site with a relatively undisturbed site with similar geographical and climatic conditions. With this rationale, the only variable would be stressors resulting from human development and disturbance. The following table lists the 12 variables measured in the IBI and their applicability depending on particular sites.
Index of Biotic Integrity Components in Ohio
| Variable Measured | Type of Site | |
|---|---|---|
| 1. | Total Number of Species | H W B |
| 2. | Number of Darter Species | H W |
| Percent Round-bodied Suckers | B | |
| 3. | Number of Sunfish Species | W B |
| Number of Headwater Species | H | |
| 4. | Number of Sucker Species | W B |
| Number of Minnow Species | H | |
| 5. | Number of Intolerant Species | W B |
| Number of Sensitive Species | H | |
| 6. | Percent of Tolerant Species | H W B |
| 7. | Percent of Omnivorous Species | H W B |
| 8. | Percent of Insectivorous Species | H W B |
| 9. | Percent of Top Carnivores | W B |
| Percent of Pioneering Species | H | |
| 10. | Number of Individuals | H W B |
| 11. | Percent of Hybrids | W B |
| Number of Simple Lithophilic Species | ||
| 12. | Percent of DELT Anomalies | H W B |
Type of Site: H-Headwater, W-Wading, B-Boat
IBI scores can range from 12-60 depending on the amount of disturbance that has taken place at and around the sampling site. Possible scores range from:
DELT-Deformities, eroded fins, lesions, and tumors
IBI criteria as taken from Ohio EPA 1987a
Maximum Score of 12(variables) * 5(highest score) = 60
Minimum score of 12(variables) * 1(lowest score) = 12
Invertebrate Community Index
Invertebrate Community Index
The invertebrate community index (ICI) is very similar to the IBI and measures the health of the macroinvertebrate community. This index is comprised of 10 metrics where sampled sites are also compared to relatively undisturbed sites with similar geographical features. Both IBI and ICI are useful tools for biological measuring of aquatic environments, but IBI is often the preferred method; fish are generally longer lived and can therefore represent environmental changes over a longer period of time.
Invertebrate Community Index Components
| Variable Measured | |
|---|---|
| 1. | Total Number of Taxa |
| 2. | Total Number of Mayfly Taxa |
| 3. | Total Number of Caddissfly Taxa |
| 4. | Total Number of Dipteran Taxa |
| 5. | Percent of Mayflies |
| 6. | Percent of Caddisflies |
| 7. | Percent of Tribe Tanutarsini Midges |
| 8. | Percent of Other Dipterans and Non-insects |
| 9. | Percent of Tolerant Organisms |
| 10. | Total Number of EPT Taxa |
EPT- Ephemroopters, Plecoptera, and Trichoptera (specific types of invertebrate taxa); ICI criteria as taken from Ohio EPA 1989
Modeled after IBI, ICI can receive a score of 6, 4, 2, or 0 depending on the undisturbed site comparison. Each site can therefore range between:
- Total maximum ICI score of 10(variables) * 6(highest score) = 60
- Total minimum ICI score of 10(variables) * 0(lowest score) = 0
Qualitative Habitat Evaluation Index
Qualitative Habitat Evaluation Index
The qualitative habitat evaluation index (QHEI) gives scientists a quantitative assessment of physical characteristics of a sampled stream similar to IBI and ICI biological data. QHEI represents a measure of instream geography. By combining evaluations of QHEI and IBI, for example, researchers can gain a well-rounded perspective of both the physical and biological conditions of a particular stream site. This comprehensive assessment is critical for evaluating disturbance and land use practices. There are six variables which comprise this index (represented in the following table).
Qualitative Habitat Evaluation Components
| Metric | Metric Component | Best Possible Score |
|
|---|---|---|---|
| Substrate |
|
20 | 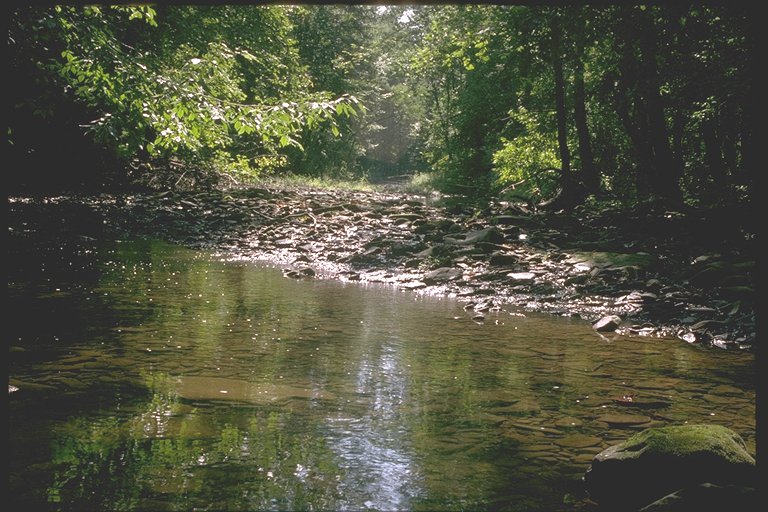 |
| Instream Cover |
|
20 | 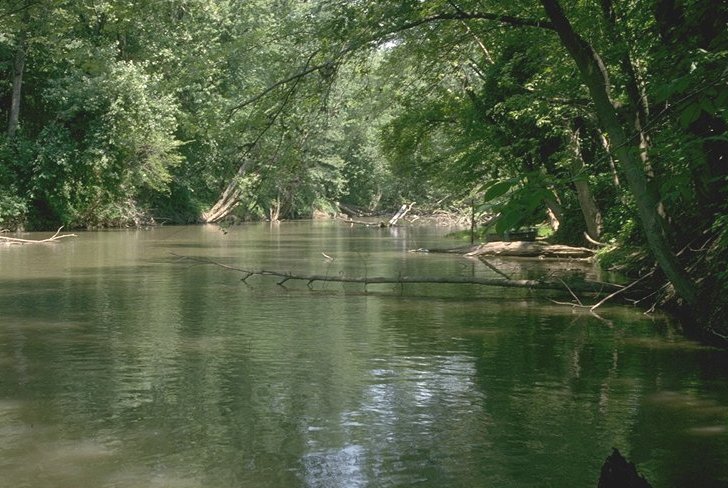 |
| Channel Morphology |
|
20 | 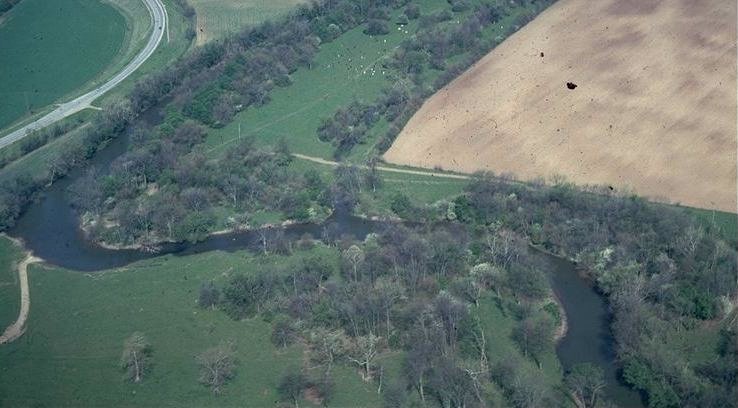 |
| Riparian Zone |
|
10 | 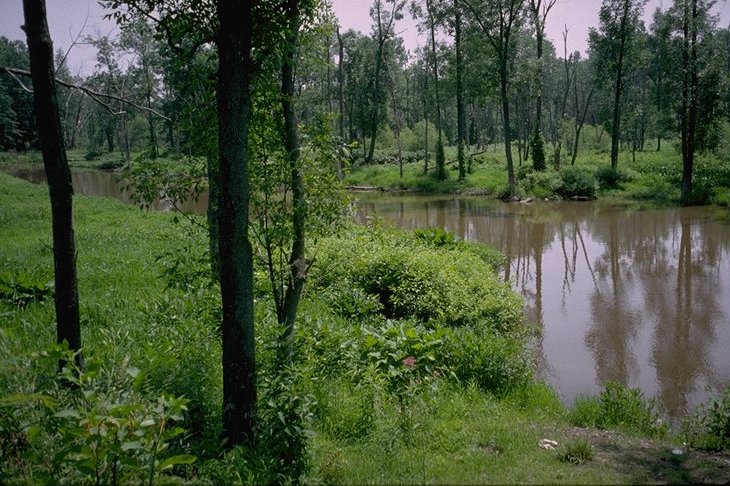 |
| Pool Quality |
|
12 | 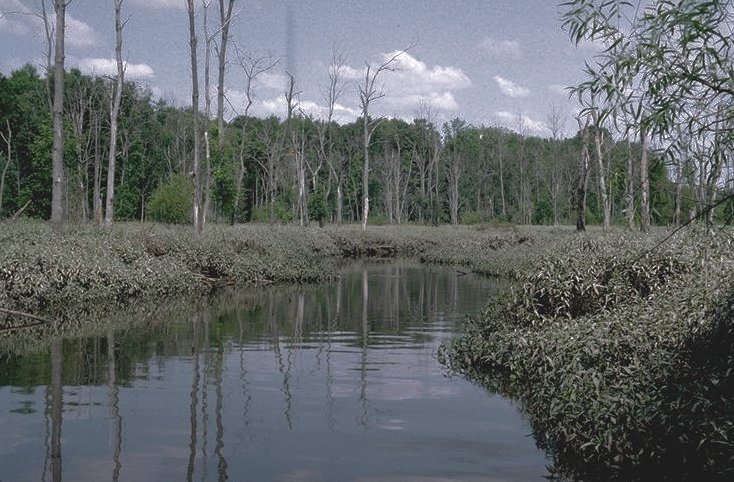 |
| Riffle Quality |
|
8 | 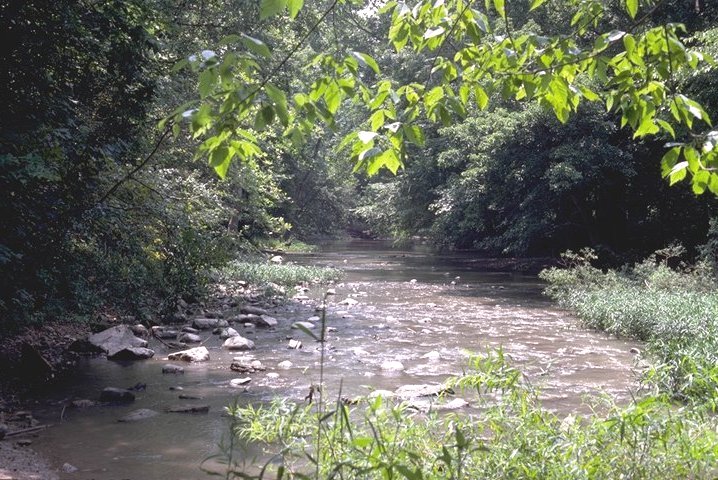 |
| Map Gradient |
10 | 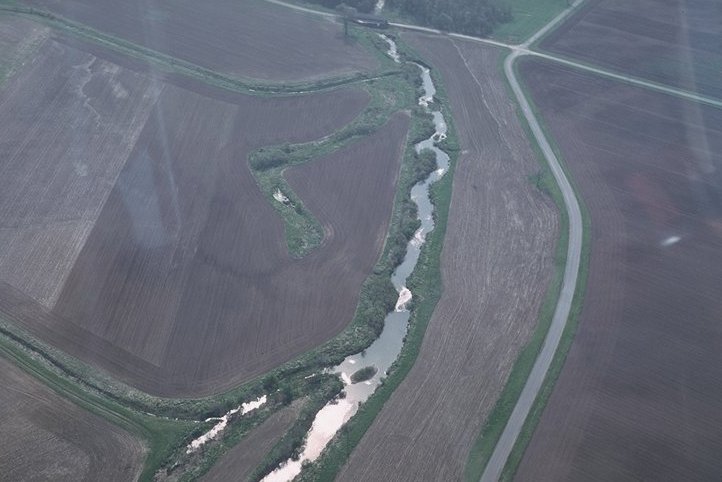 |
|
| TOTAL | 100 |
Go Back to Watershed Quality Page
Metrics for QHEI:
Substrate: This metric includes two components, substrate type and substrate quality.
- Type: The two most common types are to be scored, unless one substrate predominates (greater than 75%-80% of bottom area). Substrate types are defined as follows:
- Bedrock: solid rock forming a continuous surface
- Boulder: rounded stones over 256mm in diameter or large "slabs" more than 256mm in length
- Cobble: stones from 64-256mm in diameter
- Gravel: mixture of rounded coarse material from 2-64mm in diameter
- Sand: materials 0.06-2.0mm in diameter; gritty texture
- Silt: 0.004-0.06mm in diameter; fine material generally feels "greasy" when rubbed between fingers
- Hardpan: particles less than 0.004mm in diameter; usually clay that forms a dense, gummy surface that is difficult to penetrate
- Marl: calcium carbonate; usually greyish-white; often contains mollusk shell fragments
- Detritus: dead, unconsolidated organic material covering the bottom; includes sticks, wood, and other partially decayed plant material
- Muck: black, fine, flocculent, completely decomposed organic matter
- Artificial: substrates such as rock baskets, gabions, bricks, trash, concrete, etc., placed in stream for reasons other than habitat mitigation
- Sludge: a thick layer of organic matter that is of human origin; if originates from point source, not included
- Quality: When scoring quality, origin refers to the parent material that the stream substrate is derived from. Embeddedness is the degree to which cobble, gravel, and boulder substrates are surrounded, impacted, or covered by fine materials. Substrates should be considered embedded if more than 50% of the surface of substrates are embedded (cannot be easily dislodged). This includes substrates that are concreted or "armour-plated". Scoring Extensiveness of the sampling area is as follows: Extensive is 75% of area, Moderate is 50%-75% of area, Sparse is 25%-50% of area, and Low is less than 25% of area.
Silt cover is the extent to which the substrate is covered by silt. Silt heavy means that nearly all of the stream bottom is layered with a deep covering of silt. Moderate includes extensive coverings of silts, but with some areas of cleaner substrates. Normal silt cover includes areas where silt is deposited in small amounts along the stream margin or is present as a "dusting" that appears to have little functional significance. Silt free substrates are those that are exceptionally clean of silt.
Instream Cover: The first half of instream cover is the type that is present. Any cover that is in more than five percent of the sampling area should be noted, but should not be counted if in areas of the stream that are too shallow (usually <20 cm) to make it useful. Instream cover amount can be categorized by: extensive, moderate, sparse, or nearly absent. Extensive cover is that which is present in greater than 75 percent of the sampling area. Moderate is about 25%-75%, Sparse is less than 25%, and Nearly Absent is when no large patch of any type exists anywhere in the sampling area.
Channel Morphology: Relates to quality of the stream with regard to creation and stability of macrohabitat. This includes: channel sinuosity, channel development, channelization, and channel stability.
- Sinuosity: The degree to which a stream bends. No sinuosity means the channel is straight. Low sinuosity would have one or two poorly defined bends. Moderate has more than two outside bends, with at least one being well defined. High sinuosity would have more than two or three well defined outside bends with deep areas outside and shallow areas inside.
- Development: Refers to development of riffle pool complexes. Poor means no riffles or shallow ones with sand and fine gravel. Fair are poorly developed or absent riffles. Good implies better defined riffles with larger substrates. Excellent means the riffles are good and pools have a maximum depth of more than one meter and deep riffles and runs are present.
- Channelization: Refers to human-made channel modifications. Recovered means that the streams were channelized in the past, but have since regained most of their natural characteristics. Recovering means the stream was channelized, but is in the process of regaining its former , natural characteristics. Recent or No Recovery implies that the stream was recently channelized or show no significant recovery.
- Stability: How stable the channel remains. Channels with stable banks and substrates with little or no erosion are categorized as High stability. Artificially stable (concrete) channels also receive the High mark. Moderate scores are given to channels with stable riffle/pool and channel characteristics, but also exhibit symptoms of instability. Low scores go to channels with fine substrates in riffles, unstable (eroding) banks, and high bedload.
Riparian Zone: This metric measures the quality of the riparian buffer zone of floodplain vegetation, including riparian zone width, floodplain quality, and extent of bank erosion. To score each component, one looks downstream and averages both the left and right banks.
- Width of Floodplain: This is the width of the riparian vegetation. Estimates should only be taken for forest, shrub, swamp, and old field vegetation (fairly mature successional field that has stable, woody plant growth).
- Floodplain Quality: The two most predominant floodplain quality types are to be checked. Floodplain refers to areas immediately outside of the riparian zone or greater than 100 feet from the stream, whichever is wider on each side of the stream.
- Bank Erosion: This can have one of five different scorings:
- None-streambanks are stable and not being changed by water flows or animals
- Little-streambanks are stable, but slightly changed along the transect line; less than 25% of streambank is receiving any stress, is false, broken down, or eroding
- Moderate-streambanks are receiving moderate alteration along transect line; at least 50% of streambank is in natural stable condition; 50% is false, broken down, or eroding
- Heavy-streambanks have received major alterations along transect lines; less than 50% of streambank is in stable condition; over 50% of streambank is false, broken down, or eroding
- Severe-streambanks along transect lines are severely altered; less than 25% of bank is stable condition; over 75% of bank is false, broken down, or eroding
Pool Quality: Pool quality consists of three areas: maximum depth of pool or glide, current type, and morphology.
- Depth: This can range from a score from zero to six. A pool or glide with maximum depths of less than 20 cm are considered to have lost their function and the total metric score is zero.
- Current Type: There are seven possible categories for current type:
- Torrential-extremely turbulent with fast flow and large waves; water surface very broken with no consistently connected surface
- Fast-mostly non-turbulent flow with small standing waves in riffle-run areas; water surface partially broken, but some areas of consistent connectivity of surface
- Moderate-detectable and visible non-turbulent flow; water surface visibly connected
- Slow-water flow is perceptible, but very sluggish
- Eddies-small areas of circular current usually formed in pools just downstream from riffle-run areas
- Interstitial-flow only perceptible in interstitial spaces between substrate particles in riffle-run areas
- Intermittent-no flow; standing pools separated by dry areas
- Morphology: This category would be checked wide if pools are wider than riffles, equal if pools and riffles are the same size, and narrow if riffles are wider than pools. If morphology varies throughout the site, average the types.
Riffle Quality: If no riffles exist, a zero should be recorded. If not, riffle quality consists of three areas:
- Riffle Depth: A score from zero to four is to be chosen to describe the depth characteristics of the riffle. If the riffle is less than five cm deep, riffles are considered to have lost their function and a score of zero should be recorded.
- Substrate Stability: A score from zero to two is chosen that best describes the substrate type and stability of the riffle habitats.
- Embeddedness: This is the degree that cobble, gravel, and boulder substrates are surrounded or covered by fine material. Substrates are embedded if more than half of the surface of the substrate is embedded in the fine material (are not easily dislodged), including substrates that are cemented. Extensiveness of the embeddedness in the area sampled is also recorded: extensive is 75% of stream area; moderate is 50%-75% of area; sparse is 25%-50% of area; low is less than 25% of area.
Back to QHEI Table Map Gradient: Calculated from USGS 7.5 minute topographic maps by measuring elevation drop through the sampling area. First, the stream length is measured between the first contour line upstream and the first contour line downstream of sampling site and then dividing the distance by the contouring interval. A minimum distance of one mile should be used if contours are "packed" together.
Best Management Practices
Best Management Practices
Best management practices (BMPs) are effective practices that act to reduce the nonpoint pollution load in water systems and decrease the velocity of runoff after storm events. These practices are usually created and maintained for long-term use and coincide with the local water quality standards for a particular area. Selection and suitability of a BMP should be based on: site specific conditions, type of land use activity, the physical makeup of the watershed, and consideration of the pollutant(s) involved.
Agricultural
|
Conservation Tillage and No-Till |
- Conservation tillage is an agricultural BMP that provides long-term crop residues and vegetation on croplands. This practice greatly reduces erosion and surface runoff of heavy metals and pesticides, which may reside in higher concentrations in the surrounding soil. No-plow is a similar practice that minimizes the spring influx of sediment into nearby waters by anchoring the soil to the plant root systems. Either way, by retaining crop residue and vegetative cover, this practice reduces time and energy on the farmer, it delays the warming and drying of the soil, and overall maintains a higher quality of soil.
|
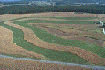
Contour strip cropping |
- Various rowcrops and hay in alternating strips planted side-by-side can reduce soil loss of about 50% compared to the same rotation contoured on its own. This practice is effective in that it provides rotated crops in different parts of the soil which act to strengthen the soil characteristics over time by not continually depleting the resource based on a monoculture. This process also decreases erosion and runoff and increases the stability of the local soil.
|
Livestock Husbandry |
- Simple practices can be implemented to offset livestock impacts on nearby streams and rivers. By providing an alternative water source, for example, livestock would not be forced to wade in the streams and therefore would not be as likely to contribute to excess nutrient input from wastes. Large concentrations of wastes can speed up eutrophication of a stream, which will eventually decrease the effectiveness of the watershed's sustainability. Another effect of livestock in waterways is the increased potential for erosion by streambank deterioration from trampling and compaction. An alternative to better manage for the watershed could include creating a bridge to connect pastures where the animals can easily cross the stream without directly interacting with the water system.
Urban and Suburban
Vegetative Buffers
|
Filter Strips |
- Filter strips are wide areas of vegetation that act to intercept runoff. They can consist of any type of dense vegetation from woodlands to grass and can remove various pollutants, such as heavy metals, sediment loads, and excess organic materials.
|
Grassed Swales |
Swales are shallow channel depressions where runoff flows. These swales slow the flow of the runoff water and allow particulates to settle out and water to infiltrate into the soil. These swales can effectively remove small amounts of excess nutrients and heavy metals.
|
Constructed Wetlands |
- Constructed wetlands are often used in mitigation of other areas that lost wetlands due to development. Both natural and constructed wetland areas are saturated for sufficient time periods and are able to support unique vegetation adapted for life in such conditions. Wetlands are extremely efficient in filtering sediment, nutrients, and some heavy metals from storm water runoff and overflow of nearby water systems.
|
Stormwater Retention |
- Structures are often built in residential areas to alleviate stormwater runoff and retain or detain precipitation from storm events. Detention ponds are basins that temporarily store runoff from a site and release it at a controlled rate to minimize downstream flooding. These ponds are quite effective for pollutant removal, especially suspended sediments, if well designed.

|
Infiltration Trenches |
- These trenches are shallow, usually three to eight feet deep, and backfilled with gravel to create underground reservoirs. Runoff, therefore, is diverted to the trenches and percolates into the subsoil. Such a practice effectively removes sediments and similar particles from stormwater runoff. This practice is commonly used in both commercial and residential areas.

|
Short-term Construction |
- Construction sites, while under development, can implement many BMPs to reduce runoff, decrease pollutant loads to nearby water systems, and decrease the amount of soil washed from the site. Simple practices, such as setting up straw bales, silt fences, or even filter fabrics can act to slow runoff and retain sediment during storm events. Other practices, such as sediment basins to detain runoff or stabilizing entrances of construction, further decrease sediment and pollutant runoff.
Maintenance Practices
- Citizens, commercial businesses, and even local and state agencies can implement and maintain efficient BMPs by taking the conservative approach to many everyday landscaping events. For example, sufficiently seeding grass to promote long-term stabilization of soil surfaces and planting wildflower cover (a practice used by many highway departments to provide aesthetically pleasing vegetation along roadways) greatly reduces the potential for erosion by securing the surfaces with plant roots. Other practices such as sodding and mulching can also be applied and have similar effective results.
Research Report on Ohio Watersheds
Under the guidance of Steven I. Gordon, graduate students and planners in The Ohio State University's City and Regional Planning Program (OSU CRP) have created a screening tool based on geographical information systems (GIS) and data provided by the Ohio Environmental Protection Agency (OEPA) and the United States Environmental Protection Agency (USEPA) that can provide planners, environmental organizations, government agencies, and concerned citizens an interactive opportunity to examine potential changes and their effects within particular watersheds throughout Ohio. It can also provide information on the potential impacts of certain changes on the biological diversity in the inter-related rivers and streams.
A full length report detailing the research and methods supporting this interactive mapping and web-based watershed information sharing approach can be viewed by clicking here - See full report. This report is available in PDF format.
Watershed Glossary
Watershed Glossary
Benthic - Referring to bottom-dwelling aquatic organisms.
Bioaccumulation - The increase in the concentration of a chemical in an organism that resides in an environment contaminated by low concentrations of various organic compounds.
Biological magnification - The increase in the concentration of a heavy metal (i.e., mercury) or organic contaminants (i.e., chlorinated hydrocarbons-CBCs) in organisms as a result of their consumption with in a food chain/web.
Biological Diversity - Describes attributes of species richness, genetic variation, and complexity within an ecosystem.
Buffer Zones - In general, an area used to separate conflicting uses. In relation to riparian and watershed management areas, its a zone that can be maintained to minimize impacts to the local water resource (i.e., vegetative buffer strips along a creek).
Channelization - Navigation or flood control projects that widen, deepen, or straighten streams, canals, or rivers. Environmental consequences associated with channelization include bank erosion, increased sedimentation and flooding, and decreased biomass.
Conservation Tillage - Any sequence of tillage that reduces loss of water or soil relative to conventional tillage.
Discharge - Volume of water flowing past a point in a water system for a specific time interval.
Ecosystem - A biological community and the local, surrounding non-biological factors associated with it
Erosion - Process of wearing away of a surface by physical means (water, wind, ice).
Eutrophication - Addition of excessive nutrients (usually nitrates or phosphates) to a body of water, leading to overgrowth of aquatic plants.
Frequency - Stable rivers can accommodate natural levels of water resulting from typical storms. However, with increased runoff water entering the system from surrounding areas with impervious roadways and surfaces lacking vegetation, water levels quickly rise to less manageable levels. High water levels, with greater than normal velocities can accelerate the rate of bank erosion, increase sediment load, and displace aquatic species of plants and animals.
Hydrologic cycle - The flows and stocks of water in the ecosphere including the processes of precipitation, evaporation, transpiration, condensation, and surface and subsurface runoff.
Impervious - Description of a material that prevents passage of a fluid (i.e., asphalt surfaces)
Infiltration - Downward entry of water into the soil profile
Interception - Capture of precipitation by surfaces and structures (i.e., vegetation)
Macrophytes - Large rooted or floating aquatic plants.
Methylation - The process by which an element (commonly a metal) is joined with a methyl group (CH4). For example, methyl mercury is produced from an atom of mercury bonded to a methyl group. This compound is produced in the natural environment chiefly by bacteria following contamination of ionic, inorganic forms of mercury. This new compound then becomes absorbed by various organisms, moves up levels of a food chain, and increases its concentration with each level.
Oxides - Gases containing (for our purposes) either nitrogen or sulfur combined with oxygen. The most common oxides contributing to pollution include nitrogen dioxide (NO2) and sulfur dioxide (SO2). Both types of gases are major air pollution contributors. Sources of pollution from oxides typically include smokestacks, exhaust, and sulfur-containing compounds.
Percolation - Downward movement of water within the soil profile.
Phytoplankton - Microscopic plants, such as algae, suspended in aquatic environments.
Riparian - Type of wetland transition zone between upland habitats and aquatic habitats. Lush vegetation along a stream is usually associated with a riparian area.
Runoff - The portion of storm water or snow melt that enters a water system instead of entering the ground through infiltration.
Sedimentation - Soil particles, clay, sand, or other materials settle out of a fluid suspension into the bottom of a body of water. Human caused earth-moving activities such as agriculture and construction greatly increase sediment load.
Slope - The degree of deviation of a surface from the horizontal plane, usually measured in a percent, degrees or numerical ratio.
Species Richness - A measure of the number of species in relation to the total number of individuals in a particular community.
Substrate - In terms of river/stream characteristics, substrate usually refers to both inorganic and organic particles on the stream bed. Examples of substrates include: bedrock, boulder, cobble, gravel, silt, sand, detritus, muck, and artificial.
Tillage - Mechanical manipulation of soil, usually associated with agriculture in terms of crop production.
Trophic Level - All the members of an ecological community that are the same number of food-chain steps from the primary source of energy.
Turbidity - A measure of the amount of suspended material (sediment) in water based on the relative ability of light to penetrate the water's surface. This cloudiness of water due to excess sediment, is an extremely important factor in maintaining aquatic diversity. Many sensitive organisms, especially fish, require relatively clear water conditions for reproducing and finding prey. Some organisms, like shell-fish are filter-feeders and continually filter the water in the environment. These organisms can become choked by sediment and eventually die in heavily turbid waters.
Watershed - The area of land that drains into a stream or lake, synonymous with drainage basin.
Use Your Knowledge to be a Watershed Detective
We are going to ask you to look at some data from a watershed and try to figure out how pollution and habitat changes have led to changes in the biology. You can use any of the materials and the websites we showed you as sources of information. You can also ask your teacher or any of the OSC instructors for help if you don't understand something. All of you will do part of the exercise. We will then ask each person in your group to take on a part of the detective work and to present what you find to your group when you are done. Before you start, your teacher will assign you a number between one and four so that you know which part to do.
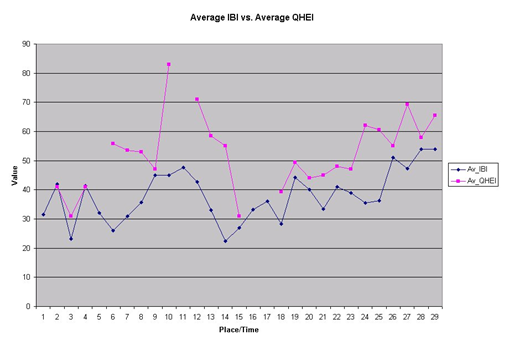
Here is the first part for everyone to do. The graph below and all of the graphs are set up to show you the relationship between pairs of data. In most cases, one of the data items will be one of the biological measures - IBI or ICI - the fish or macroinvertebrates that are impacted by pollution and habitat changes. The other data item is a possible cause of that change. The data items represent samples taken in the watershed over a sampling season - mostly the summer. They were taken at different places so we divided the watershed into small parts and have reported the data so that each line represents a single year summary and one part of the watershed. The data were taken at several times over the season so that we summarize the information by providing the average, maximum, and minimum values for each variable.
Here is the graph for average IBI versus average QHEI. Study it and answer the questions on the next page.
|
|
|
More Detective Work
What is Happening in Your Watershed?
As watershed detectives, you looked for patterns that indicated cause and effect relationships. In order to “prove” scientifically that there is a cause and effect relationship, we want to make sure that the relationship is almost always true. Because we are studying watersheds where many things happen at one time, where there are many causes and many effects, this is sometimes very difficult.
Look at the graph below. It appears that at most times and most places, when QHEI goes up, IBI also goes up and when QHEI goes down, IBI also goes down. We might hypothesize that this is true because good habitat should allow for a better fish population. For the 29 observations in the diagram below, count how many times/places where this is true, how many times it is not true, and how many times where there are no data.
Based on what you found, should we accept our hypothesis that better QHEI results in better IBI? Why or why not?
For the places where it is not true, what else could be happening? What would cause fish diversity to go down even if there is good habitat? How would we look for other evidence associated with the places and times where the other hypothesis did not hold?
