Knowledge Base
This knowledge base is a collection of important, useful information about OSC systems that does not fit into a guide or tutorial, and is too long to be answered in a simple FAQ.
Account Consolidation Guide
Single Account / Multiple Projects
If you work with several research groups, you had a separate account for each group. This meant multiple home directories, multiple passwords, etc. Over the years there have been requests for a single login system. We've now put that in place.
How will this affect you?
If you work with multiple groups, you'll need to be aware of how this works.
- It will be very important to use the correct project code for batch job charging.
- Managing the sharing of files between your projects (groups) is a little more complicated.
- In most cases, you will only need to fill out software license agreements once.
The single username
We requested those with multiple accounts to choose a preferred username. If one was not selected by the user, we selected one for them.
The preferred username will be your only active account; you will not be able to log in or submit jobs with the other accounts.
Checking the groups of a username
To check all groups of a username (USERID), use the command:
groups USERID
or
OSCfinger USERID
The first one from the output is your primary group, which is the project code (PROJECTID) this username (USERID) was created under.
All project codes your user account is under is determined by the groups displayed. One can also use the OSC Client Portal to look at their current projects.
Changing the primary group for a login session
You can change the primary group of your username (USERID) to any UNIX group (GROUP) that username (USERID) belongs to during the login session using the command:
newgrp GROUP
This change is only valid during this login session. If you log out and log back in, your primary group is changed back to the default one.
Check previous user accounts
There is no available tool to check all of your previous active accounts. We sent an email to each impacted user providing the information on your preferred username and previous accounts. Please refer to that email (sent on July 11, subject "Multiple OSC Accounts - Your Single Username").
Batch job
How to specify the charging project
Specify a project to charge the job to using the -A flag. e.g. The following example will charge to project PAS1234.
#SBATCH -A PAS1234
Batch limits policy
The job limit per user remains the same. That is to say, though your jobs are charged against different project codes, the total number of jobs and cores your user account can use on each system is still restricted by the previous user-based limit. Therefore, consolidating multiple user accounts into one preferred user account may affect the work of some users.
Please check our batch limit policy on each system for more details.
Data Management
Managing multiple home directories
Data from your non-preferred accounts will remain in those home directories; the ownership of the files will be updated to your preferred username, the newly consolidated account. You can access your other home directories using the command cd /absolute/path/to/file
You will need to consolidate all files to your preferred username as soon as possible because we plan to purge the data in future. Please contact OSC Help if you need the information on your other home directories to access the files.
Previous files associated with your other usernames
- Files associated with your non-preferred accounts will have their ownership changed to your preferred username.
- These files won't count against your home directory file quota.
- There will be no change to files and quotas on the project and scratch file systems.
Change group of a file
Log in with preferred username (P_ USERID) and create a new file of which the owner and group is your preferred username (P_ USERID) and primary project code (P_PROJECTID). Then change the group of the newly created file (FILE) using the command:
chgrp PROJECTID FILE
Managing file sharing in a batch job
In the Linux file system, every file has an owner and a group. By default, the group (project code) assigned to a file is the primary group of the user who creates it. This means that even if you change the charged account for a batch job, any files created will still be associated with your primary group.
To change the group for new files you will need to update your primary group prior to submitting your slurm script using the newgrp command.
It is important to remember that groups are used in two different ways: for resource use charging and file permissions. In the simplest case, if you are a member of only one research group/project, you won't need either option above. If you are in multiple research groups and/or multiple projects, you may need something like:
newgrp PAS0002
sbatch -A PAS0002 myjob.sh
OnDemand users
If you use the OnDemand Files app to upload files to the OSC filesystem, the group ownership of uploaded files will be your primary group.
Software licenses
- We will merge all your current agreements if you have multiple accounts.
-
In many cases, you will only need to fill out software license agreements once.
- Some vendors may require you to sign an updated agreement.
- Some vendors may also require the PI of each of your research groups/project codes to sign an agreement.
Community Accounts
Some projects may wish to have a common account to allow for different privileges than their regular user accounts. These are called community accounts, in that they are shared among multiple users, belong to a project, and may be able to submit jobs. Community accounts are accessed using the sudo command.
A community sudo account has the following characteristics:
- Selected users in the project have sudo privileges to become the community sudo user.
- The community sudo account has different privileges than the other users in the project, which may or may not include job submission.
- Community accounts can not be used to SSH into OSC systems directly.
- The community sudo account can only be accessed after logging in as a regular user and then using the sudo command described below. The community sudo account does not have a regular password set and is therefore is not subject to the normal password change policy.
- SSH key exchange to access OSC systems from outside of OSC with community accounts is disabled. Key exchange may be used to SSH between hosts within an OSC cluster.
How to Request a Community Account
The PI of the project looking to create a community account needs to send an email to OSC Help with the following information:
- A preferred username for the community account
- The project code that the community account will be created under
- The elevated privileges desired (such as job submission)
- The users who will able to access the account via sudo
- The desired shell for the community account
OSC will then evaluate the request.
Logging into a Community Account
Users who have been given access to the community account by the PI will be able to use the following command to log in:
sudo -u <community account name> /bin/bash
Once you successfully enter your own password you will assume the identity of the community account user.
Submitting Jobs From a Community Account
You can submit jobs the same as your normal user account. The email associated with the community account is noreply@osc.edu. Please add email recipients in your job script if you would like to receive notifications from the job.
Add multiple email recipients in a job using
#SBATCH --mail-user=<email address>
Adding Users to a Community Account
The PI of the project needs to send an email to OSC Help with the username of the person that they would like to add.
Checking jobs in XDMoD
To check the statistics of the jobs submitted by the community account in XDMoD, the PI of the project will need to send an email to OSC Help with the username of the community account.
Data Management
The owner of the data on the community account will be the community account user. Any user that has assumed the community account user identity will have access.
Access via OnDemand
The only way to access a community account is via a terminal session. This can be either via an SSH client or the terminal app within OnDemand. Other apps within OnDemand such as Desktops or specific software can not be utilized with a community account.
Compilation Guide
Pitzer Compilers
The Skylake processors that make up the original Pitzer cluster and the Cascade Lake processors in its expansion support the AVX512 instruction set, but you must set the correct compiler flags to take advantage of it. AVX512 has the potential to speed up your code by a factor of 8 or more, depending on the compiler and options you would otherwise use.
With the Intel compilers, use -xHost and -O2 or higher. With the gnu compilers, use -march=native and -O3. The PGI compilers by default use the highest available instruction set, so no additional flags are necessary.
This advice assumes that you are building and running your code on Pitzer. The executables will not be portable. Of course, any highly optimized builds, such as those employing the options above, should be thoroughly validated for correctness.
Intel (recommended)
| NON-MPI | MPI | |
|---|---|---|
| FORTRAN 90 | ifort |
mpif90 |
| C | icc |
mpicc |
| C++ | icpc |
mpicxx |
Recommended Optimization Options
The -O2 -xHost options are recommended with the Intel compilers. (For more options, see the "man" pages for the compilers.
OpenMP
Add this flag to any of the above: -qopenmp
PGI
| NON-MPI | MPI | |
|---|---|---|
| FORTRAN 90 | pgfortran or pgf90 |
mpif90 |
| C | pgcc |
mpicc |
| C++ | pgc++ |
mpicxx |
Recommended Optimization Options
The -fast option is appropriate with all PGI compilers. (For more options, see the "man" pages for the compilers)
OpenMP
Add this flag to any of the above: -mp
GNU
| NON-MPI | MPI | |
|---|---|---|
| FORTRAN 90 | gfortran |
mpif90 |
| C | gcc |
mpicc |
| C++ | g++ |
mpicxx |
Recommended Optimization Options
The -O2 -march=native options are recommended with the GNU compilers. (For more options, see the "man" pages for the compilers)
OpenMP
Add this flag to any of the above: -fopenmp
Intel (recommended)
| NON-MPI | MPI | |
|---|---|---|
| FORTRAN 90 | ifort |
mpif90 |
| C | icc |
mpicc |
| C++ | icpc |
mpicxx |
Recommended Optimization Options
The -O2 -xHost options are recommended with the Intel compilers. (For more options, see the "man" pages for the compilers.
OpenMP
Add this flag to any of the above: -qopenmp or -openmp
PGI
| NON-MPI | MPI | |
|---|---|---|
| FORTRAN 90 | pgfortran or pgf90 |
mpif90 |
| C | pgcc |
mpicc |
| C++ | pgc++ |
mpicxx |
Recommended Optimization Options
The -fast option is appropriate with all PGI compilers. (For more options, see the "man" pages for the compilers)
OpenMP
Add this flag to any of the above: -mp
GNU
| NON-MPI | MPI | |
|---|---|---|
| FORTRAN 90 | gfortran |
mpif90 |
| C | gcc |
mpicc |
| C++ | g++ |
mpicxx |
Recommended Optimization Options
The -O2 -march=native options are recommended with the GNU compilers. (For more options, see the "man" pages for the compilers)
OpenMP
Add this flag to any of the above: -fopenmp
Further Reading:
Firewall and Proxy Settings
Connections to OSC
In order for users to access OSC resources through the web your firewall rules should allow for connections to the following publicly-facing IP ranges. Otherwise, users may be blocked or denied access to our services.
- 192.148.248.0/24
- 192.148.247.0/24
- 192.157.5.0/25
The followingg TCP ports should be opened:
- 80 (HTTP)
- 443 (HTTPS)
- 22 (SSH)
The following domain should be allowed:
- *.osc.edu
Users may follow the instructions below "Test your configuration" to ensure that your system is not blocked from accessing our services. If you are still unsure of whether their network is blocking theses hosts or ports should contact their local IT administrator.
Test your configuration
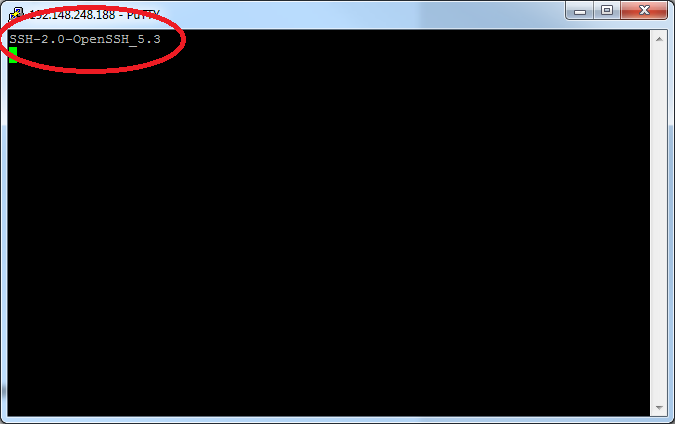
[Windows] Test your connection using PuTTY
- Open the PuTTY application.
- Enter IP address listed in "Connections to OSC" in the "Host Name" field.
- Enter 22 in the "Port" field.
- Click the 'Telnet' radio button under "Connection Type".
- Click "Open" to test the connection.
- Confirm the response. If the connection is successful, you will see a message that says "SSH-2.0-OpenSSH_5.3", as shown below. If you receive a PuTTY error, consult your system administrator for network access troubleshooting.
[OSX/Linux] Test your configuration using telnet
- Open a terminal.
- Type
telnet IPaddress 22(Here,IPaddressis IP address listed in "Connections to OSC"). - Confirm the connection.
Connections from OSC
All outbound network traffic from all of OSC's compute nodes are routed through a network address translation host (NAT) including the following IPs:
- 192.148.249.248
- 192.148.249.249
- 192.148.249.250
- 192.148.249.251
IT and Network Administrators
Please use the above information in order to assit users in acessing our resources.
Occasionally new services may be stood up using hosts and ports not described here. If you believe our list needs correcting please let us know at oschelp@osc.edu.
Job and storage charging
All others should contact OSC Sales for pricing information.
Job charging based on usage
Jobs are charged based length, number of cores, amount of memory, single node versus multi-node, and type of resource.
Length and number of cores
Jobs are recorded in terms of core-hours hours used. Core-hours can be calculated by:
number of cores * length of job
e.g.
A 4 core job that runs for 2 hours would have a total core-hour usage of:
4 cores * 2 hours = 8 core-hours
Amount of Memory
Each processor has a default amount of memory paired along with it, which differs by cluster. When requesting a specifc amount of memory that doesn't correlate with the default pairing, the charging uses an algorithm to determine if the effective cores should be used.
The value for effective cores will be used in place of the actual cores used if and only if it is larger than the explicit number of cores requested.
effective cores = memory / memory per core
e.g.
A job that requests nodes=1:ppn=3 will still be charged for 3 cores of usage.
However, a job that requests nodes=1:ppn=1,mem=12GB, where the default memory allocated per core is 4GB, then the job will be charged for 3 cores worth of usage.
effective cores = 12GB / (4GB/core) = 3 core
Single versus Multi-Node
If requesting a single node, then a job is charged for only the cores/processors requested. However, when requesting multiple nodes the job is charged for each entire node regardless of the number of cores/processors requested.
Type of resource
Depending on the type of node requested, it can change the dollar rate charged per core-hour. There are currently three types of nodes, regular, hugememory,and gpu.
If a gpu node is used, there are two metrics recorded, core-hours and gpu-hours. Each has a different dollar-rate, and these are combined to determine the total charges for usage.
All others should contact OSC Sales for pricing information.
e.g.
A job requests nodes=1:ppn=8:gpus=2 and runs for 1 hour.
The usage charge would be calculated using:
8 cores * 1 hour = 8 core-hours
and
2 gpus * 1 hour = 2 gpu-hours
and combined for:
8 core-hours + 2 gpu-hours
Project storage charging based on quota
Projects that request extra storage be added are charged for that storage based on the total space reserved (i.e. your quota).
The rates are in TB per month:
storage quota in TB * rate per month
All others should contact OSC Sales for pricing information.
Out-of-Memory (OOM) or Excessive Memory Usage
Problem description
A common problem on our systems is that a user's job causes a node out of memory or uses more than its allocated memory if the node is shared with other jobs.
If a job exhausts both the physical memory and the swap space on a node, it causes the node to crash. With a parallel job, there may be many nodes that crash. When a node crashes, the OSC staff has to manually reboot and clean up the node. If other jobs were running on the same node, the users have to be notified that their jobs failed.
If your job requests less than a full node, for example, --ntasks-per-node=4, it may be scheduled on a node with other running jobs. In this case, your job is entitled to a memory allocation proportional to the number of cores requested. For example, if a system has 4.5 GB per core and you request one core, it is your responsibility to make sure your job uses no more than 4.5 GB. Otherwise your job will interfere with the execution of other jobs.
In addition, our current GPFS file system is a distributed process with significant interactions between the clients. As the compute nodes being GPFS flle system clients, a certain amount of memory of each node needs to be reserved for these interactions. As a result, the maximum physical memory of each node allowed to be used by users' jobs is reduced, in order to keep the healthy performance of the file system. In addition, using swap memory is not allowed.
Example errors
# OOM in a parallel program launched through srun
slurmstepd: error: Detected 1 oom-kill event(s) in StepId=14604003.0 cgroup. Some of your processes may have been killed by the cgroup out-of-memory handler.

srun: error: o0616: task 0: Out Of Memory
# OOM in program run directly by the batch script of a job
slurmstepd: error: Detected 1 oom-kill event(s) in StepId=14604003.batch cgroup. Some of your processes may have been killed by the cgroup out-of-memory handler.
Background
Each node has a fixed amount of physical memory and a fixed amount of disk space designated as swap space. If your program and data don’t fit in physical memory, the virtual memory system writes pages from physical memory to disk as necessary and reads in the pages it needs. This is called swapping.
You can see the memory and swap values for a node by running the Linux command free on the node.
In the world of high-performance computing, swapping is almost always undesirable. If your program does a lot of swapping, it will spend most of its time doing disk I/O and won’t get much computation done. Swapping is not supported at OSC. Please consider the suggestions below.
Suggested solutions
Here are some suggestions for fixing jobs that use too much memory. Feel free to contact OSC Help for assistance with any of these options.
Some of these remedies involve requesting more processors (cores) for your job. As a general rule, we require you to request a number of processors proportional to the amount of memory you require. You need to think in terms of using some fraction of a node rather than treating processors and memory separately. If some of the processors remain idle, that’s not a problem. Memory is just as valuable a resource as processors.
Request whole node or more processors
Jobs requesting less than a whole node are those that request less than the total number of available cores. These jobs can be problematic for two reasons. First, they are entitled to use an amount of memory proportional to the cores requested; if they use more they interfere with other jobs. Second, if they cause a node to crash, it typically affects multiple jobs and multiple users.
If you’re sure about your memory usage, it’s fine to request just the number of processors you need, as long as it’s enough to cover the amount of memory you need. If you’re not sure, play it safe and request all the processors on the node.
Reduce memory usage
Consider whether your job’s memory usage is reasonable in light of the work it’s doing. The code itself typically doesn’t require much memory, so you need to look mostly at the data size.
If you’re developing the code yourself, look for memory leaks. In MATLAB look for large arrays that can be cleared.
An out-of-core algorithm will typically use disk more efficiently than an in-memory algorithm that relies on swapping. Some third-party software gives you a choice of algorithms or allows you to set a limit on the memory the algorithm will use.
Use more nodes for a parallel job
If you have a parallel job you can get more total memory by requesting more nodes. Depending on the characteristics of your code you may also need to run fewer processes per node.
Here’s an example. Suppose your job includes the following lines:
#SBATCH --nodes=2
#SBATCH --ntasks-per-node=48
…
mpiexec mycode
This job has 2 nodes worth of memory available to it (specifically 178GB * 2 nodes of memory). The mpiexec command by default runs one process per core, which in this case is 96 copies of mycode.
If this job uses too much memory you can spread those 96 processes over more nodes. The following lines request 4 nodes, giving you a total of 712 GB of memory (4 nodes *178 GB). The -ppn 24 option on the mpiexec command says to run 24 processes per node instead of 48, for a total of 96 as before.
#SBATCH --nodes=4
#SBATCH --ntasks-per-node=48
…
mpiexec -ppn 24 mycode
Since parallel jobs are always assigned whole nodes, the following lines will also run 24 processes per node on 4 nodes.
#SBATCH --nodes=4
#SBATCH --ntasks-per-node=24
…
mpiexec mycode
How to monitor your memory usage
Grafana
If a job is currently running, or you know the timeframe that it was running, then grafana can be used to look at the individual nodes memory usage for jobs. Look for the graph that shows memory usage.
OnDemand
You can also view node status graphically using the OSC OnDemand Portal. Under "Jobs" select "Active Jobs." Click on "Job Status" and scroll down to see memory usage.
XDMoD
To view detailed metrics about jobs after waiting a day after the jobs are completed, you can use the XDMoD tool. It can show the memory usage for jobs over time as well as other metrics. Please see the job view how-to for more information on looking jobs.
sstat
Slurm command sstat can be used to obtain info for running jobs.
sstat --format=AveRSS,JobID -j <job-id> -a
During job
Query the job's cgroup which is what controls the amount of memory a job can use:
# return current memory usage
cat /sys/fs/cgroup/memory/slurm/uid_$(id -u)/job_$SLURM_JOB_ID/memory.usage_in_bytes | numfmt --to iec-i
# return memory limit
cat /sys/fs/cgroup/memory/slurm/uid_$(id -u)/job_$SLURM_JOB_ID/memory.limit_in_bytes | numfmt --to iec-i
Notes
If it appears that your job is close to crashing a node, we may preemptively delete the job.
If your job is interfering with other jobs by using more memory than it should be, we may delete the job.
In extreme cases OSC staff may restrict your ability to submit jobs. If you crash a large number of nodes or continue to submit problematic jobs after we have notified you of the situation, this may be the only way to protect the system and our other users. If this happens, we will restore your privileges as soon as you demonstrate that you have resolved the problem.
For details on retrieving files from unexpectedly terminated jobs see this FAQ.
For assistance
OSC has staff available to help you resolve your memory issues. See our client support request page for contact information.
Thread Usage Best Practices
This document serves as a knowledge base for properly managing and diagnosing threading issues in user jobs. It focuses on OpenMP, Intel Math Kernel Library (MKL), and common thread-related misuse at OSC.
Understanding Threading with OpenMP and MKL
Intel MKL is widely used in HPC for linear algebra, FFTs, and statistical routines. MKL is multithreaded by default, which can significantly improve performance but only when correctly configured.
Key Environment Variables
|
Variable |
Applies To |
Description |
|---|---|---|
|
|
All OpenMP programs |
Sets the number of threads for OpenMP. Recognized by all compilers. |
|
|
Intel MKL libraries |
Sets the number of threads for MKL. Takes precedence over |
Behavior Summary
- MKL subjects to Slurm cgroup limits and defaults to all available cores if neither variable is set.
- If both are set, MKL uses
MKL_NUM_THREADSfor its internal operations, even ifOMP_NUM_THREADSis higher. - Compiler overrides: Thread count may be overridden by compiler-specific variables (
KMP_NUM_THREADS, etc.).
Common Thread Misuse Patterns
Users often run programs in parallel using MPI or other approaches without realizing that the program was built with MKL threading or OpenMP enabled. While they may request sufficient resources for their primary parallelization method, MKL threading can still be automatically activated (as described above), leading to CPU oversubscription and performance degradation.
Commonly affected applications at OSC include R, LAMMPS, and GROMACS.
Example: Uncontrolled Threading in an MPI Job
Consider an MPI job that requests 8 CPUs:
#!/bin/bash
#SBATCH --ntasks-per-node=8

srun /path/to/mpi/program
Without properly setting OMP_NUM_THREADS or MKL_NUM_THREADS, each MPI rank may spawn 8 threads by default. This results in a total of 64 threads (8 threads × 8 ranks), which exceeds the allocated CPU resources. Such oversubscription can severely degrade performance, interfere with other users' jobs on the same node, and in extreme cases, even crash the node.
Best Practice
- Set
MKL_NUM_THREADS=1unless performance tuning suggests otherwise. - For a hybrid OpenMP + MPI program, use
--cpus-per-task=Nand setOMP_NUM_THREADS=Naccordingly. - If you are unsure whether OpenMP is needed, set
OMP_NUM_THREADS=1to disable threading safely. - Always validate effective thread usage: MPI ranks × threads per rank ≤ allocated CPU cores.
Example: Properly Configured Job Script (8 OpenMP Threads per MPI Rank)
#!/bin/bash
#SBATCH --ntasks-per-node=8
#SBATCH --cpus-per-task=8

export MKL_NUM_THREADS=1
export OMP_NUM_THREADS=$SLURM_CPUS_PER_TASK
srun /path/to/mpi/program
Example: If OpenMP Threading Is Not Needed
#!/bin/bash
#SBATCH --ntasks-per-node=8

export MKL_NUM_THREADS=1
export OMP_NUM_THREADS=1
srun /path/to/mpi/program
Note on Implicit Threading via Libraries
There are several cases where the main program is not explicitly built with MKL threading or OpenMP enabled, but its dependent libraries are. A common example is a Python program that uses NumPy. Certain NumPy operations, such as np.dot, can leverage MKL or OpenMP internally and spawn multiple threads.
In such cases, if you are unsure whether threading is needed, it is safest to follow the example above and explicitly set:
export OMP_NUM_THREADS=1
export MKL_NUM_THREADS=1
This ensures controlled thread usage and prevents unexpected oversubscription.
Uncommon Thread Misuse Cases
Some programs not designed for HPC environments may spawn multiple subprocesses or determine the number of threads by directly reading system information from /proc/cpuinfo, ignoring Slurm-imposed resource limits. In such cases, the standard thread control methods described above may not work, as the internal settings override user-defined environment variables.
Sometimes, these programs offer command-line options or configuration parameters to control threading. Users should consult the program's documentation and explicitly set the number of threads as appropriate for their job's allocated resources.
XDMoD Tool
XDMoD Overview
XDMoD, which stands for XD Metrics on Demand, is an NSF-funded open source tool that provides a wide range of metrics pertaining to resource utilization and performance of high-performance computing (HPC) resources, and the impact these resources have in terms of scholarship and research.
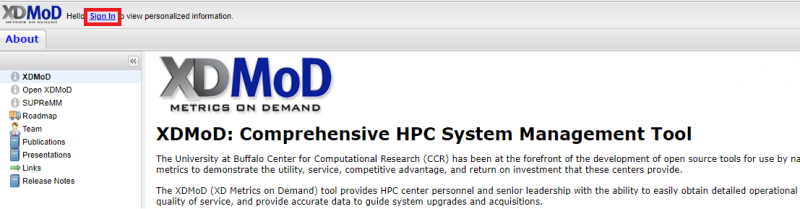
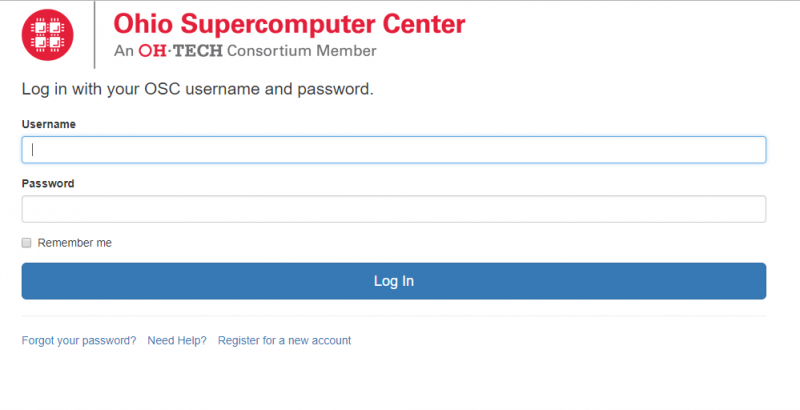
How to log in
Visit OSC's XDMoD (xdmod.osc.edu) and click 'Sign In' in the upper left corner of the page.

XDMoD Tabs
When you first log in you will be directed to the Summary tab. The different XDMoD tabs are located near the top of the page. You will be able to change tabs simply by click on the one you would like to view. By default, you will see the data from the previous month, but you can change the start and end date and then click 'refresh' to update the timeframe being reported.

Summary:
The Summary tab is comprised of a duration selector toolbar, a summary information bar, followed by a select set of charts representative of the usage. The Summary tab provides a dashboard that presents summary statistics and selected charts that are useful to the role of the current user. More information can be found at the XDMoD User Manual.
Usage:
The Usage tab is comprised of a chart selection tree on the left, and a chart viewer to the right of the page. The usage tab provides a convenient way to browse all the realms present in XDMoD. More information can be found at the XDMoD User Manual.
Metric Explorer:
The Metric Explorer allows one to create complex plots containing multiple multiple metrics. It has many points and click features that allow the user to easily add, filter, and modify the data and the format in which it is presented. More information can be found at the XDMoD User Manual.
App Kernels:
The Application Kernels tab consists of three sub-tabs, and each has a specific goal in order to make viewing application kernels simple and intuitive. The three sub-tabs consist of the Application Kernels Viewer, Application Kernels Explorer, and the Reports subsidiary tabs. More information can be found at the XDMoD User Manual.
Report Generator:
This tab will allow you to manage reports. The left region provides a listing of any reports you have created. The right region displays any charts you have chosen to make available for building a report. More information can be found at the XDMoD User Manual.
Job Viewer:
The Job Viewer tab displays information about individual HPC jobs and includes a search interface that allows jobs to be selected based on a wide range of filters. This tab also contains the SUPReMM module. More information on the SUPReMM module can be found below in this documentation. More information can be found at the XDMoD User Manual.
About:
This tab will display information about XDMoD.
Different Roles
XDMoD utilizes roles to restrict access to data and elements of the user interface such as tabs. OSC client holds the 'User Role' by default after you log into OSC XDMoD using your OSC credentials. With 'User Role', users are able to view all data available to their personal utilization information. They are also able to view information regarding their allocations, quality of service data via the Application Kernel Explorer, and generate custom reports. We also support the 'Principal Investigator' role, who has access to all data available to a user, as well as detailed information for any users included on their allocations or project.
References, Resources, and Documentation
Job Viewer
The Job Viewer Tab displays information about individual HPC jobs and includes a search interface that allows jobs to be selected based on a wide range of filters:
1. Click on the Job Viewer tab near the top of the page.
2. Click Search in the top left-hand corner of the page

3. If you know the Resource and Job Number, use the quick search lookup form discussed in 4a. If you would like more options, use the advanced search discussed in 4b.
4a. For a quick job lookup, select the resource and enter the job number and click 'Search'.

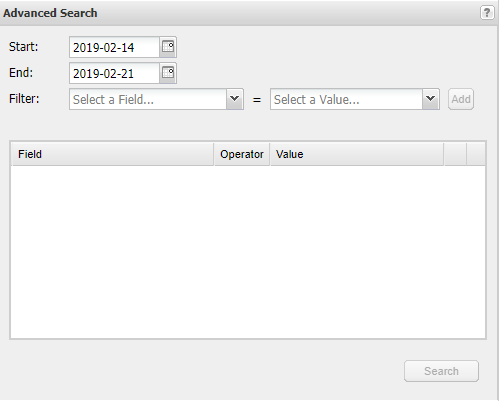
4b. Within the Advanced Search form, select a timeframe and Add one or more filters. Click to run the search on the server.
5. Select one or more Jobs. Provide the 'Search Name', and click 'Save Results' at the bottom of this window to view data about the selected jobs.
6. To view data in more details for the selected job, under the Search History, click on the Tree and select a Job.
7. More information can be found in the section of 'Job Viewer' of the XDMoD User Manual.
XDMoD - Checking Job Efficiency
Intro
XDMoD can be used to look at the performance of past jobs. This tutorial will explain how to retreive this job performance data and how to use this data to best utilize OSC resources.
First, log into XDMoD.
You will be sent to the Summary Tab in XDMoD:
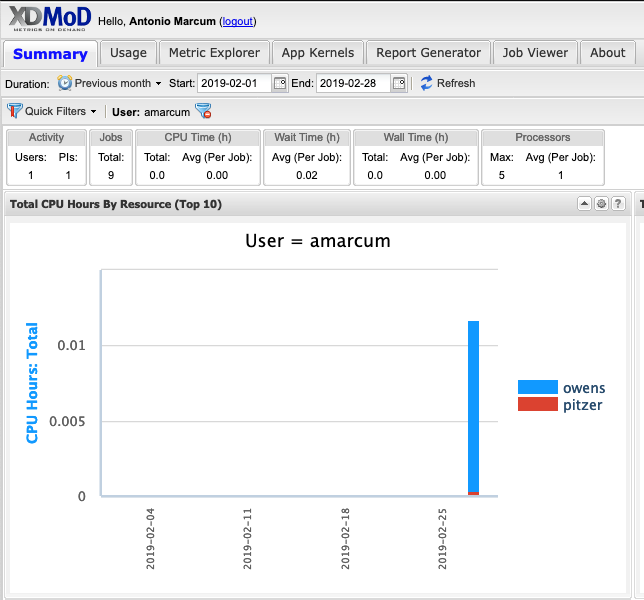
Click on the Metric Explorer tab, then navigate to the Metric Catalog click SUPREMM to show the various metric options, then Click the "Avg CPU %: User: weighted by core hour " metric.
A drop-down menu will appear for grouping the data to viewed. Group by "CPU User Value
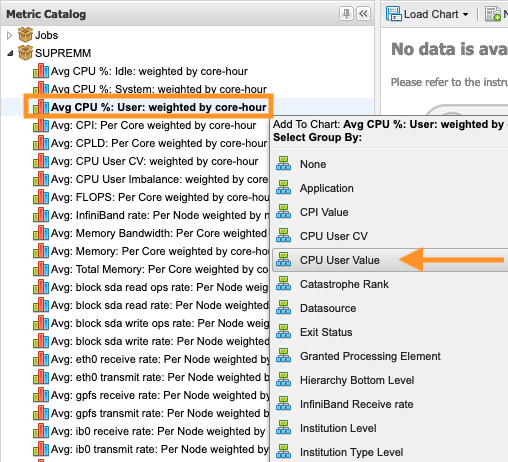 ":
":
This will provide a time-series chart showing the average 'CPU user % weighted by core hours, over all jobs that were executing' separated by groups of 10 for that 'CPU User value'.
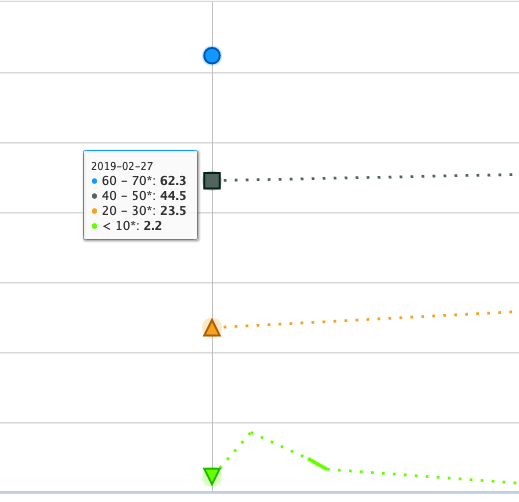
One can change the time period by adjusting the preset duration value or entering dates in the "start" and "end" boxes by selecting the calendar or manually entering dates in the format 'yyyy-mm-dd'. Once the desired time period is entered the "Refresh" button will be highlighted yellow, click the "Refresh" button to reload that time period data into the chart.

Once the data is loaded, click on one of the data points, then navigate to "Drilldown" and select "Job Wall Time". This will group the job data by the amount of wall time used.
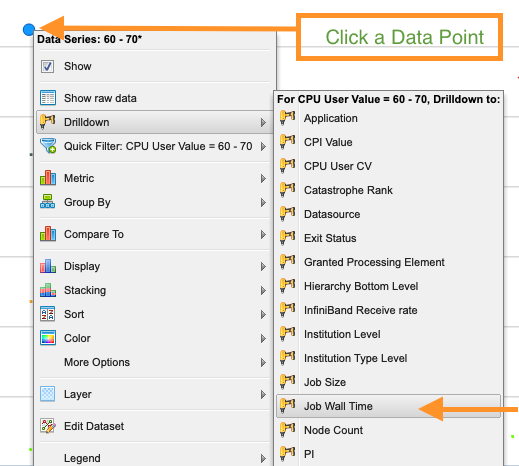
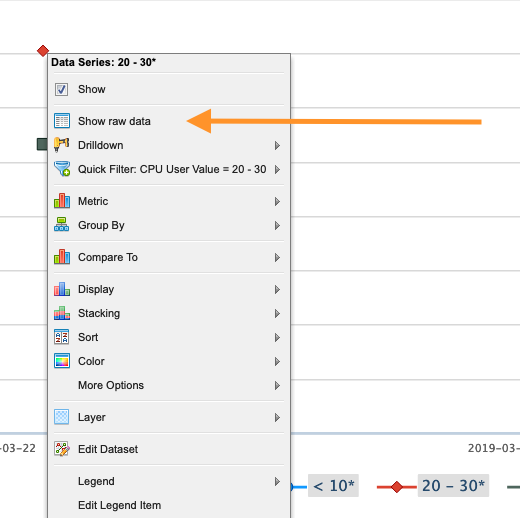
Generally, the lower the CPU User Value, the less efficient that job was. This chart can now be used to go into some detailed information on specific jobs. Click one of the points again and select "Show raw data".
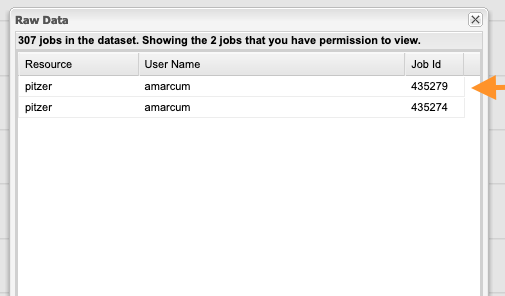
This will bring up a list of jobs included in that data point. Click one of the jobs shown.
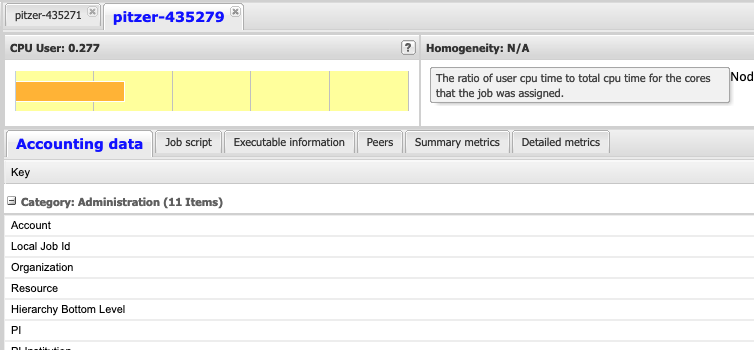
After loading, this brings up the "Job Viewer" Tab for showing the details about the job selected.

It is important to explain some information about the values immediately visible such as the "CPU User", "CPU User Balance" and "Memory Headroom".
The "CPU User" section gives a ratio for the amount of CPU time used by the job during the time that job was executing, think of it as how much "work" the CPUs were doing doing execution.
The "CPU User Balance" section gives a measure for how evenly spread the "work" was between all the CPUs that were allocated to this job while it was executing. (Work here means how well was the CPU utilized, and it is preferred that the CPUs be close to fully utilized during job execution.)
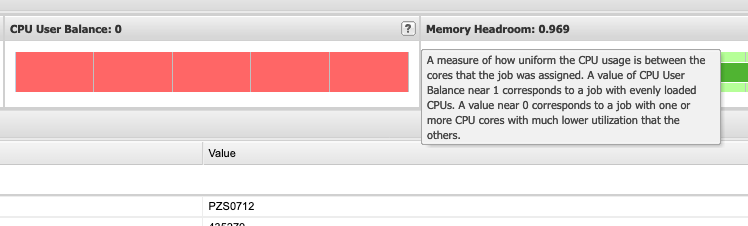
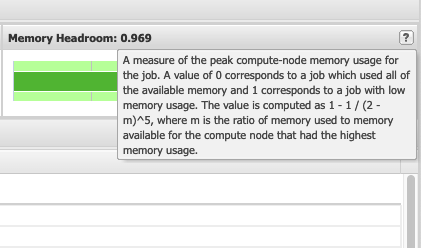
Finally, "Memory Headroom" gives a measure for the amount of memory used for that job. It can be difficult to understand what a good value is here. Generally, it is recommended to not specifically request an amount of memory unless the job requires it. When making those memory requests, it can be beneficial to investigate the amount of memory that is actually used by the job and plan accordingly. Below, a value closer to 0 means a job used most of the memory allocated to it and a value closer to 1 means that the job used less memory than the job was allocated.
This information is useful for better utilizing OSC resources by having better estimates of the resources that jobs may require.