XDMoD Overview
XDMoD, which stands for XD Metrics on Demand, is an NSF-funded open source tool that provides a wide range of metrics pertaining to resource utilization and performance of high-performance computing (HPC) resources, and the impact these resources have in terms of scholarship and research.
How to log in
Visit OSC's XDMoD (xdmod.osc.edu) and click 'Sign In' in the upper left corner of the page.

XDMoD Tabs
When you first log in you will be directed to the Summary tab. The different XDMoD tabs are located near the top of the page. You will be able to change tabs simply by click on the one you would like to view. By default, you will see the data from the previous month, but you can change the start and end date and then click 'refresh' to update the timeframe being reported.

Summary:
The Summary tab is comprised of a duration selector toolbar, a summary information bar, followed by a select set of charts representative of the usage. The Summary tab provides a dashboard that presents summary statistics and selected charts that are useful to the role of the current user. More information can be found at the XDMoD User Manual.
Usage:
The Usage tab is comprised of a chart selection tree on the left, and a chart viewer to the right of the page. The usage tab provides a convenient way to browse all the realms present in XDMoD. More information can be found at the XDMoD User Manual.
Metric Explorer:
The Metric Explorer allows one to create complex plots containing multiple multiple metrics. It has many points and click features that allow the user to easily add, filter, and modify the data and the format in which it is presented. More information can be found at the XDMoD User Manual.
App Kernels:
The Application Kernels tab consists of three sub-tabs, and each has a specific goal in order to make viewing application kernels simple and intuitive. The three sub-tabs consist of the Application Kernels Viewer, Application Kernels Explorer, and the Reports subsidiary tabs. More information can be found at the XDMoD User Manual.
Report Generator:
This tab will allow you to manage reports. The left region provides a listing of any reports you have created. The right region displays any charts you have chosen to make available for building a report. More information can be found at the XDMoD User Manual.
Job Viewer:
The Job Viewer tab displays information about individual HPC jobs and includes a search interface that allows jobs to be selected based on a wide range of filters. This tab also contains the SUPReMM module. More information on the SUPReMM module can be found below in this documentation. More information can be found at the XDMoD User Manual.
About:
This tab will display information about XDMoD.
Different Roles
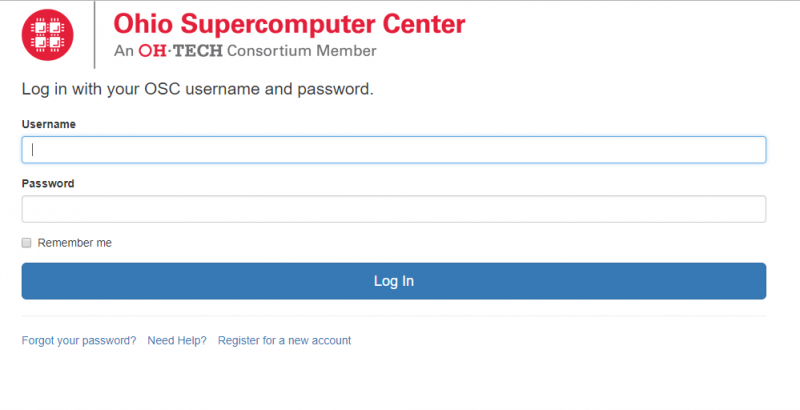
XDMoD utilizes roles to restrict access to data and elements of the user interface such as tabs. OSC client holds the 'User Role' by default after you log into OSC XDMoD using your OSC credentials. With 'User Role', users are able to view all data available to their personal utilization information. They are also able to view information regarding their allocations, quality of service data via the Application Kernel Explorer, and generate custom reports. We also support the 'Principal Investigator' role, who has access to all data available to a user, as well as detailed information for any users included on their allocations or project.
References, Resources, and Documentation