Intro
XDMoD can be used to look at the performance of past jobs. This tutorial will explain how to retreive this job performance data and how to use this data to best utilize OSC resources.
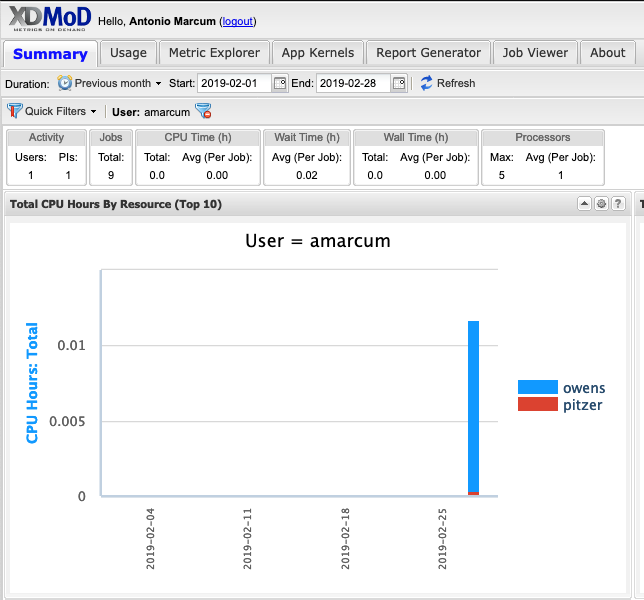
First, log into XDMoD.
You will be sent to the Summary Tab in XDMoD:
Click on the Metric Explorer tab, then navigate to the Metric Catalog click SUPREMM to show the various metric options, then Click the "Avg CPU %: User: weighted by core hour " metric.
A drop-down menu will appear for grouping the data to viewed. Group by "CPU User Value
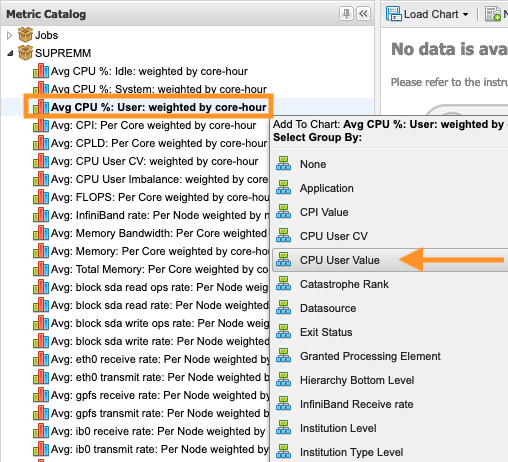 ":
":
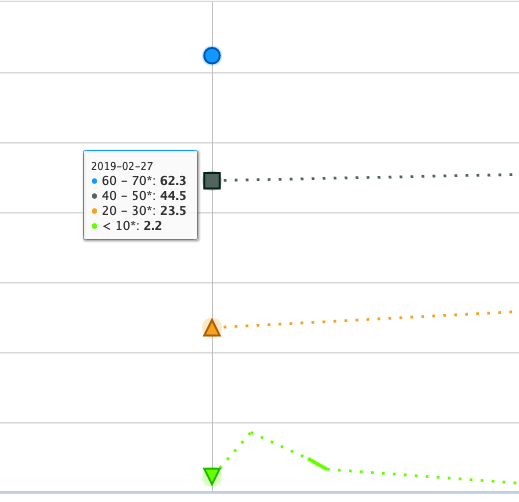
This will provide a time-series chart showing the average 'CPU user % weighted by core hours, over all jobs that were executing' separated by groups of 10 for that 'CPU User value'.
One can change the time period by adjusting the preset duration value or entering dates in the "start" and "end" boxes by selecting the calendar or manually entering dates in the format 'yyyy-mm-dd'. Once the desired time period is entered the "Refresh" button will be highlighted yellow, click the "Refresh" button to reload that time period data into the chart.

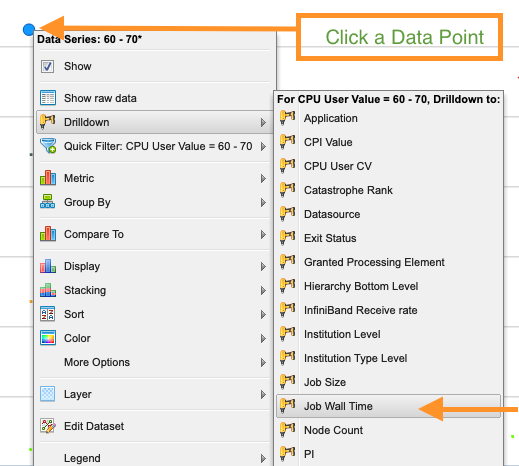
Once the data is loaded, click on one of the data points, then navigate to "Drilldown" and select "Job Wall Time". This will group the job data by the amount of wall time used.
Generally, the lower the CPU User Value, the less efficient that job was. This chart can now be used to go into some detailed information on specific jobs. Click one of the points again and select "Show raw data".
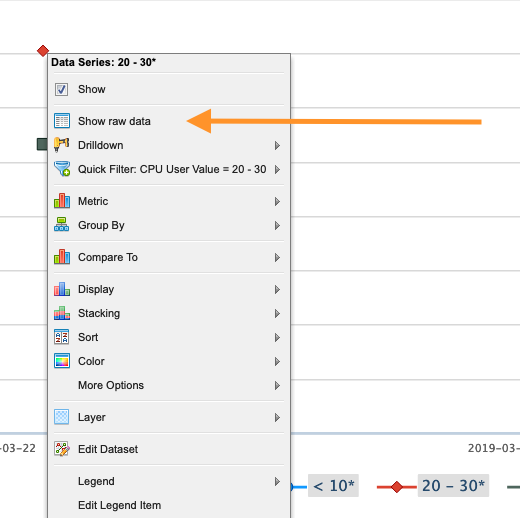
This will bring up a list of jobs included in that data point. Click one of the jobs shown.
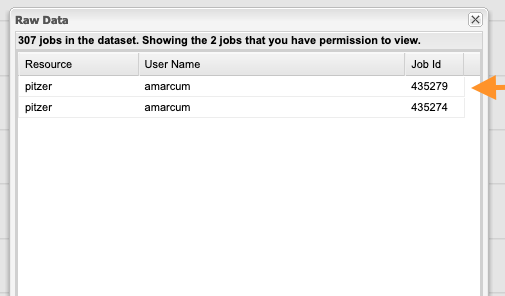
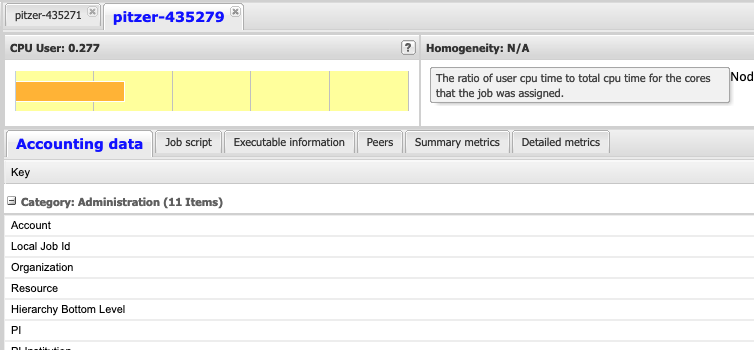
After loading, this brings up the "Job Viewer" Tab for showing the details about the job selected.

It is important to explain some information about the values immediately visible such as the "CPU User", "CPU User Balance" and "Memory Headroom".
The "CPU User" section gives a ratio for the amount of CPU time used by the job during the time that job was executing, think of it as how much "work" the CPUs were doing doing execution.
The "CPU User Balance" section gives a measure for how evenly spread the "work" was between all the CPUs that were allocated to this job while it was executing. (Work here means how well was the CPU utilized, and it is preferred that the CPUs be close to fully utilized during job execution.)
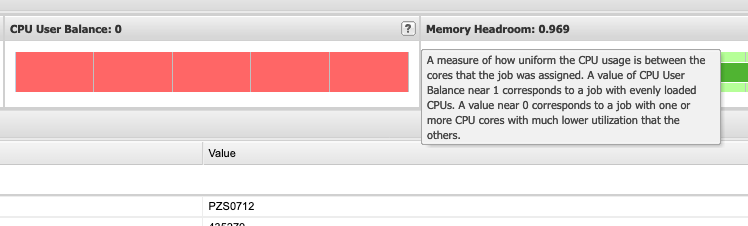
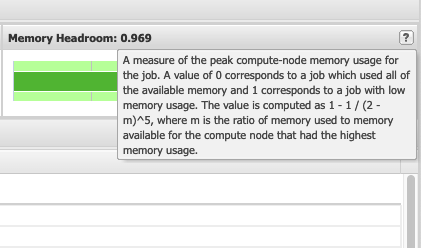
Finally, "Memory Headroom" gives a measure for the amount of memory used for that job. It can be difficult to understand what a good value is here. Generally, it is recommended to not specifically request an amount of memory unless the job requires it. When making those memory requests, it can be beneficial to investigate the amount of memory that is actually used by the job and plan accordingly. Below, a value closer to 0 means a job used most of the memory allocated to it and a value closer to 1 means that the job used less memory than the job was allocated.
This information is useful for better utilizing OSC resources by having better estimates of the resources that jobs may require.