In the client portal, interactive reporting is provided using Oracle Application Express (APEX) which allows end users to query data and customize reports. This interactive reporting allows users to:
- Customize the layout of the data by choosing the columns they are interested in, applying filters, highlighting, and sorting
- Define breaks, aggregations, different charts, and their own computations
- Create multiple variations of the report and save them as named reports, output to comma-delimited files, and print them to PDF documents
The discussions here are also applicable to other pages where data can be manipulated similarly.
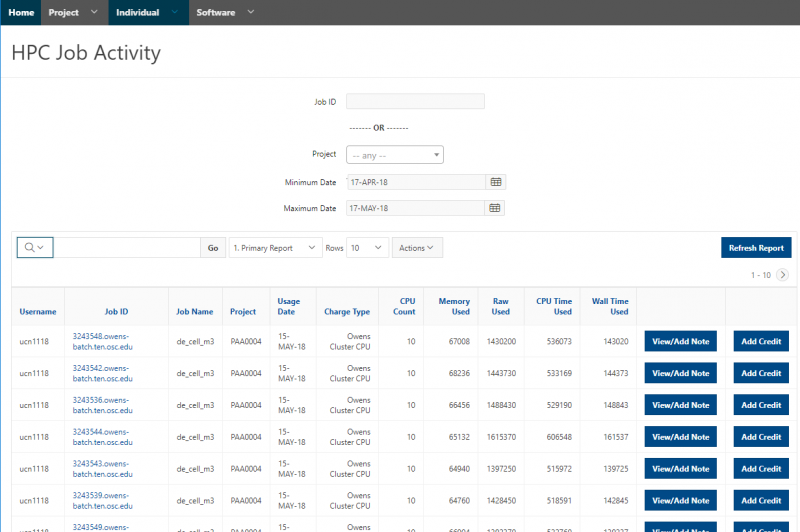
The HPC Job Activity page
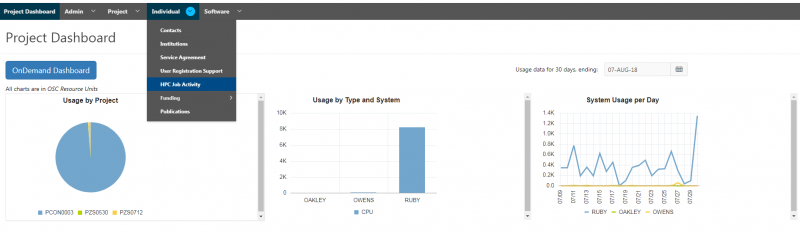
Navigate to Individual -> HPC Job Activity.
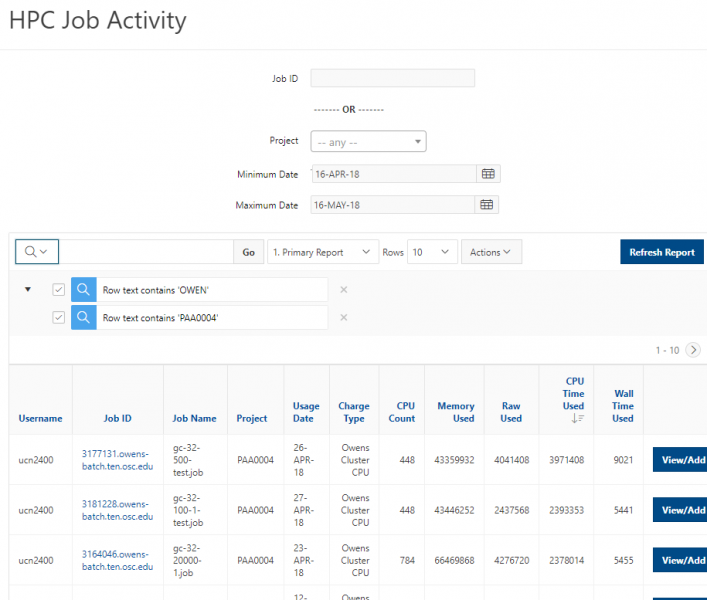
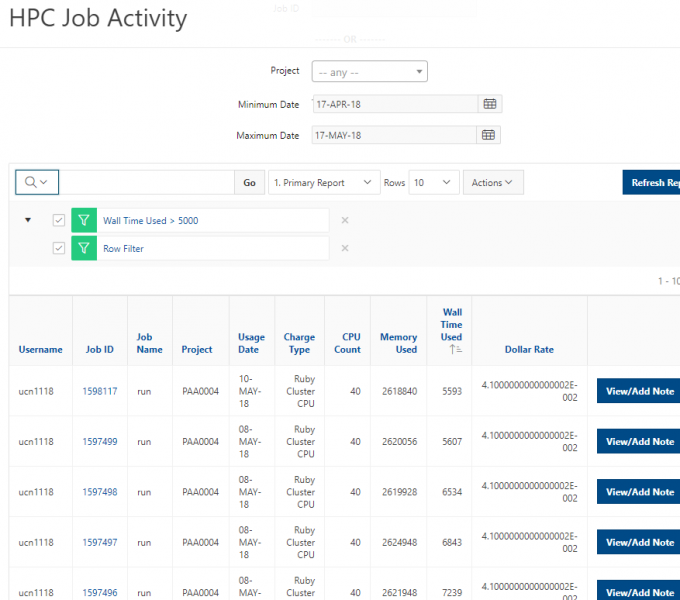
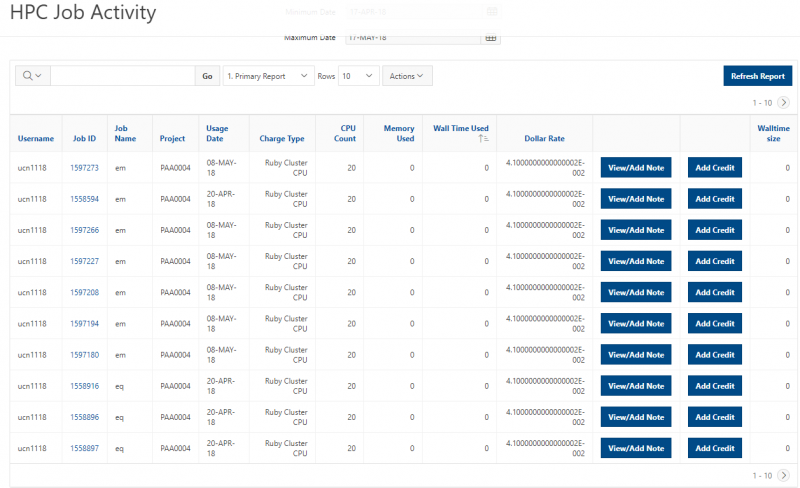
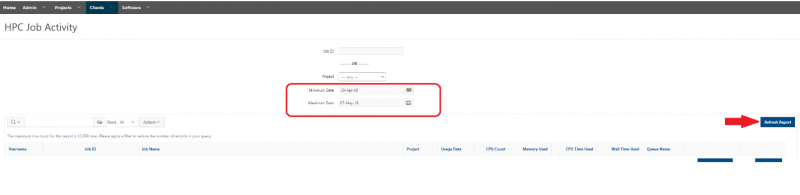
Click Refresh Report to get the job activity report as shown below. By default, the report shows a table of all activity over the last 30 days for projects you are authorized to view usage of, with 10 rows per page.
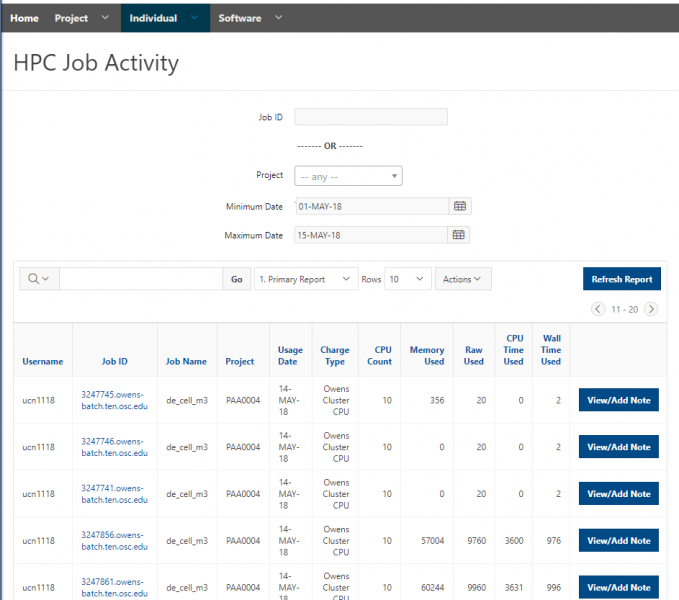
There are simple filters available at the top to put in a specific job ID, narrow the report to a specific project, or select a specific date range. Click “Refresh Report” to update the table with new filters.
For more advanced functions of using filter, see the discussion of ‘Filter’.
Column sorting and filtering
Many actions can be performed by clicking on a column heading. These include:
- Sorting data (both ascending and descending)
- Hiding the column
- Creating a control break
- Viewing of the column text and the ability to select a value to create a quick filter
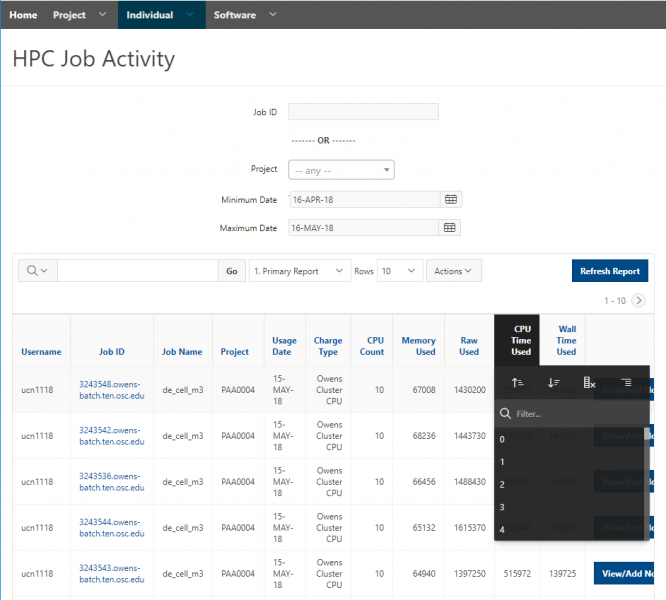
Let’s use the column ‘CPU Time Used’ as an example for detailed discussions. Click ‘CPU Time Used’:
- Click ‘
 ’, and the jobs will be listed based on the value of CPU time in ascending order
 - Click ‘
 ’, and the jobs will be listed based on the value of CPU time in descending order
 - Click ‘
 ’, and the column ‘CPU Time Used’ will be removed from the table
 - Click ‘
 ’, and the table will be split into multiple groups, where each group shares the same value of CPU time
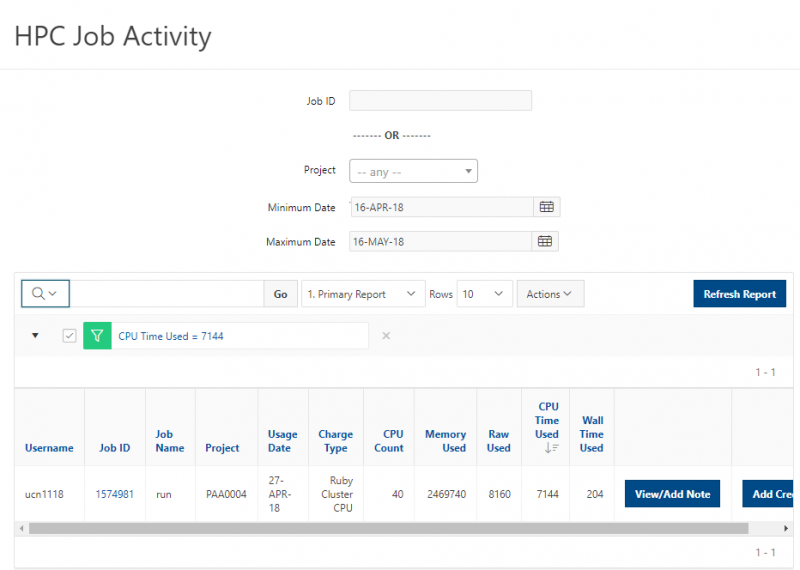
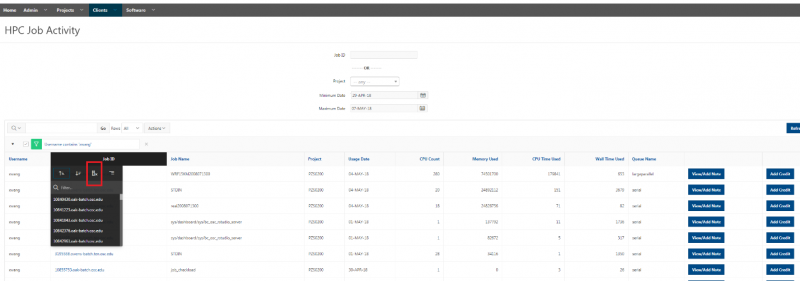
It also lists all the available values of CPU time. You can select a value to create a quick filter, and the table will be updated to list the jobs of which the CPU time is the specified value:
You can also use ‘search’ to narrow down the information to be viewed.
Adjust the displayed information in the table
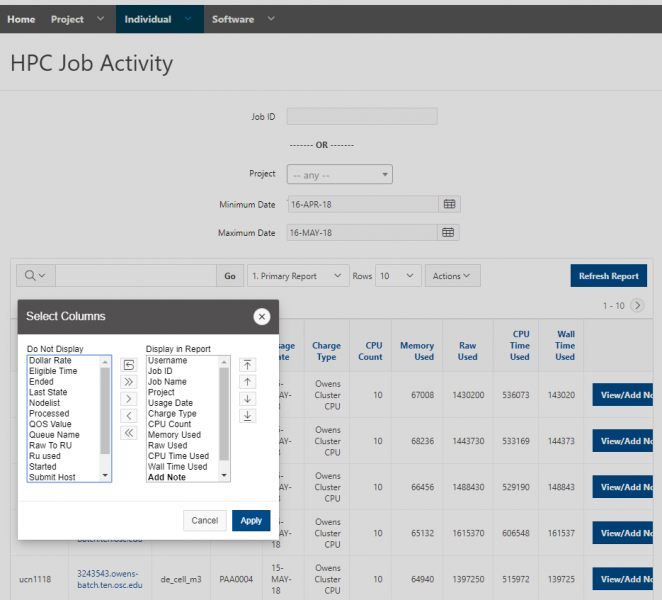
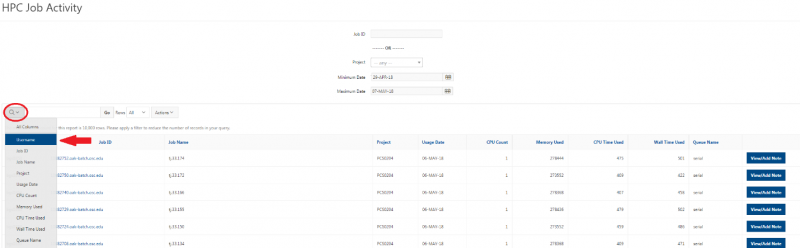
You can adjust the columns to be displayed in this table to see more/less information. Click ‘Columns’ within the ‘Actions' dropdown menu:
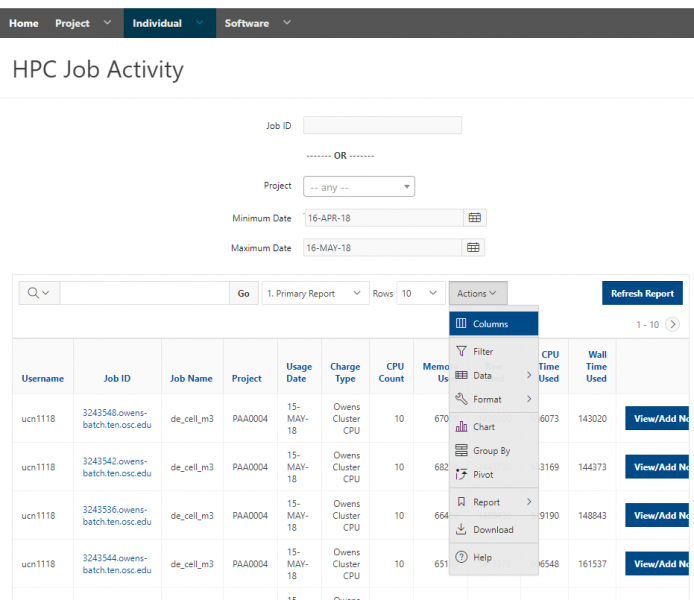
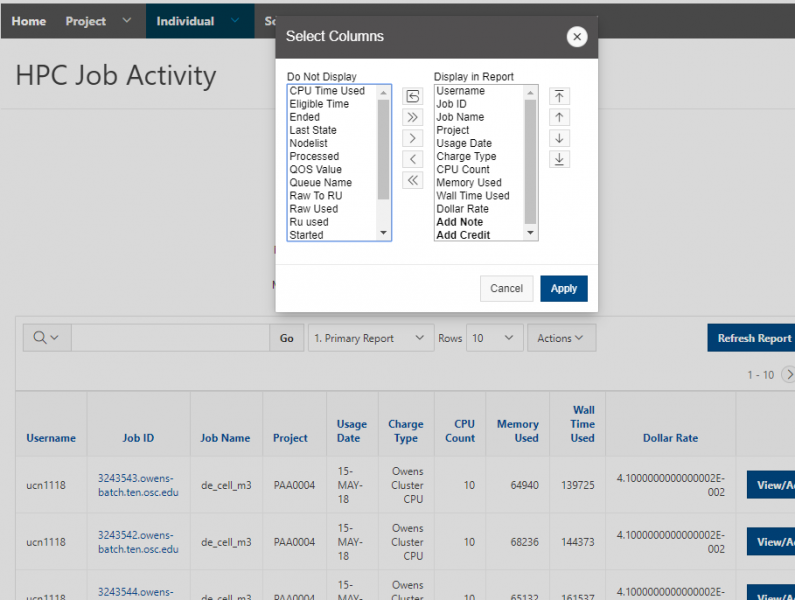
You will get the pop-up window shown below. The columns on the right are displayed. The columns on the left are hidden. Select the information to be displayed using ‘>’; select the information to be NOT displayed using ‘<’. You can also reorder the displayed columns using ‘↑’ and ‘↓’. Click ‘Apply’ button to apply the changes.
Most columns are self-explanatory. Computed columns are prefixed with **. Definitions of some columns are provided below:
- Project: which project this job is charged to
- Usage Date: the date when this job is charged
- Memory Used: in bytes
- CPU Time Used: in seconds
- Wall Time Used: in seconds
'Search' tool
The ‘Search’ tool enables you to narrow down the displayed report that contains specific text only. To search all columns, simply type the text in the search box and click on ‘Go’ or press ‘Enter’.
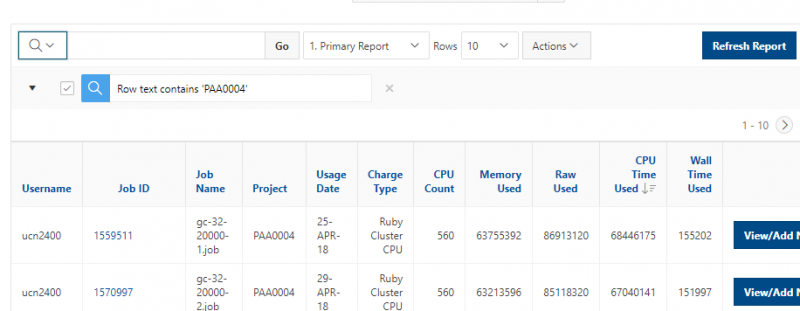
The page will be refreshed automatically to display the results following the search criterion, with the search criterion being listed above the table:
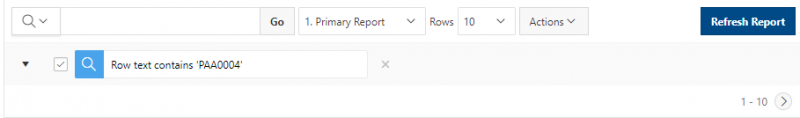
To apply multiple search criteria, add another search criterion after one search criterion is applied. Always remember to hit ‘Enter’ to apply the search criterion:
Check the box on the left to display/not display the results following this search criterion. The displayed results will be refreshed automatically:

Click the ‘x’ on the right to remove this search criterion. The displayed results will be refreshed automatically:
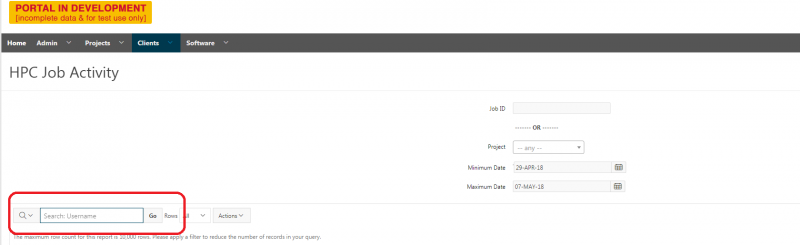
To search one specific column, select the column from the dropdown ‘˅’ to the left of the search box before providing the text in the box:
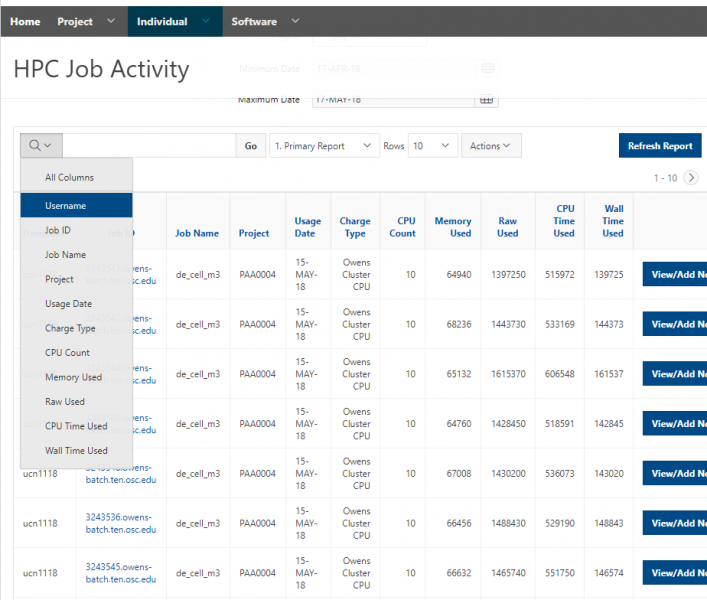
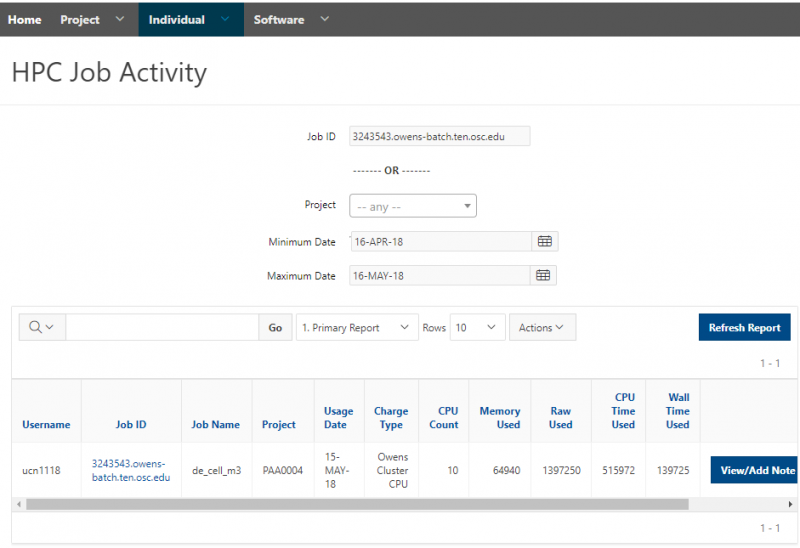
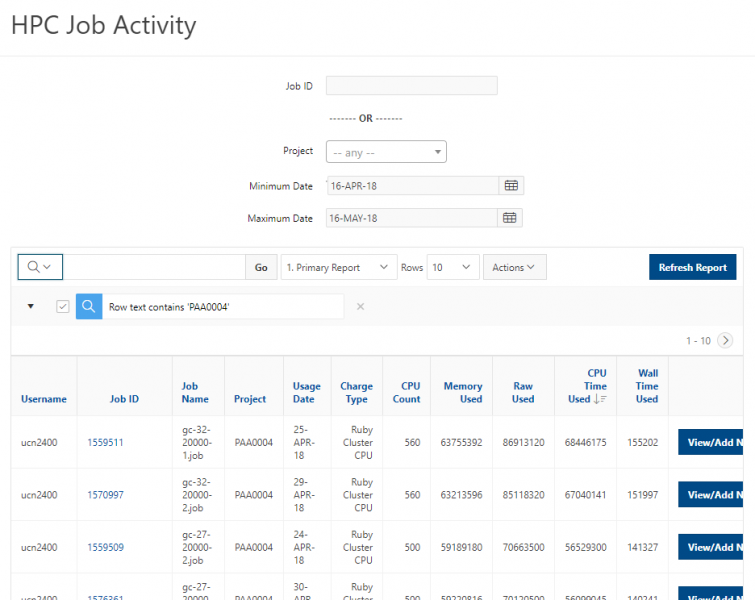
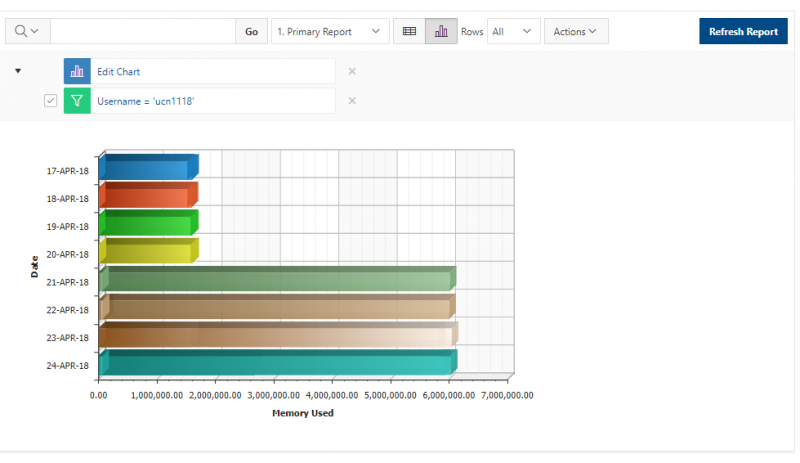
For instance, if you would like to get a report of HPC jobs submitted by user ‘ucn1118’ only, select ‘Username’ from ‘˅’. ‘Search: Username’ will be displayed in the ‘search’ box:

Type ‘ucn1118’ and hit ‘Enter’ in the box, jobs submitted by ‘ucn1118’ only will be displayed in the table, as shown below:

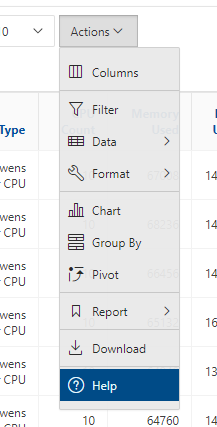
'Actions' menu
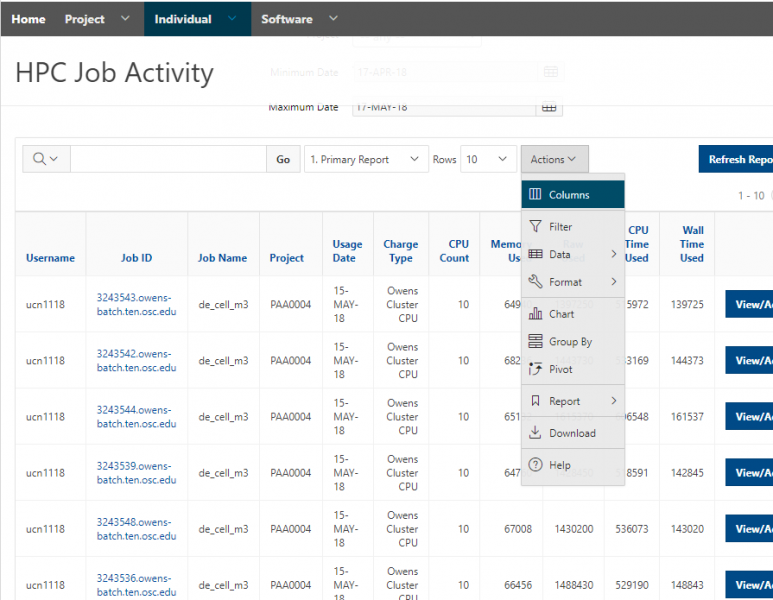
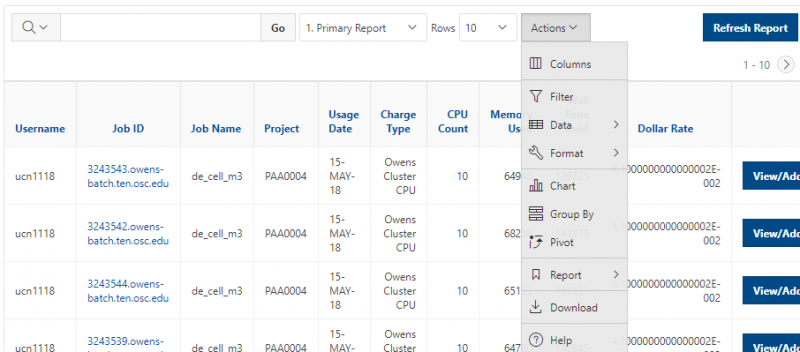
The ‘Actions’ menu contains many tasks that are useful in querying data and customizing reports. Click ‘˅’ to get a list of available functions.
For more information, see: [1] and [2]
Adjust the displayed information in the table
Click ‘Columns’ within the ‘Actions' dropdown menu, you can adjust the columns to be displayed in this table to see more/less information.
See here for more info: ‘Adjust the displayed information in the table’.
Query data and format report
Within the ‘Actions' dropdown menu, it provides the following tools to query data and format report:
- Filter
- Data
- Format
Filter
Click ‘Filter’ within the ‘Actions' dropdown menu as below:
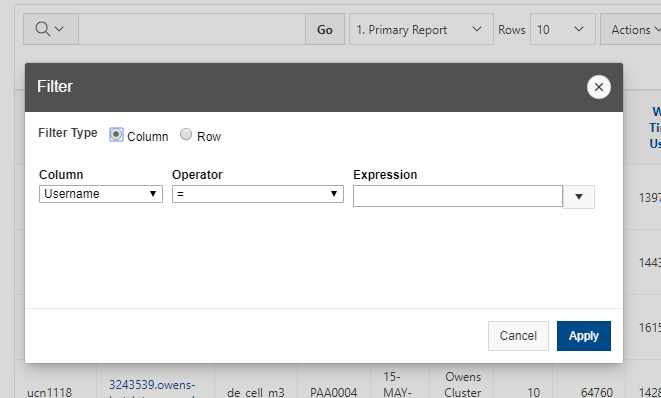
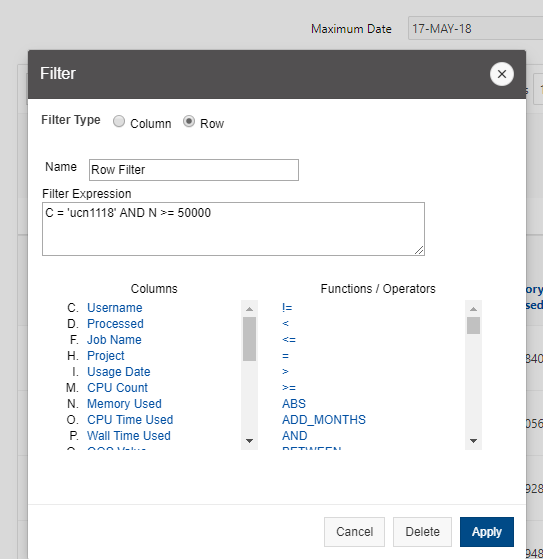
You can create the filter based on either ‘Column’ or ‘Row’.
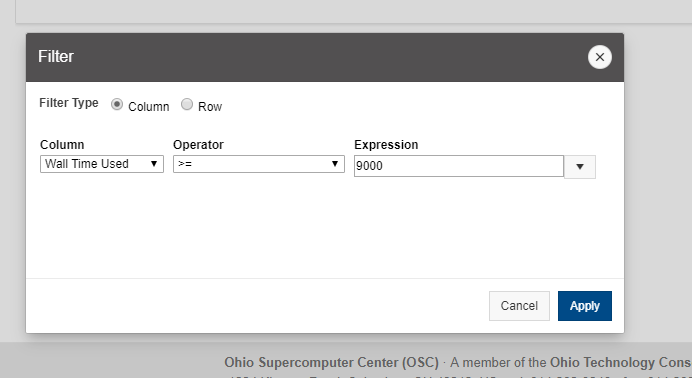
If you filter by column, select a column using ‘▼’, a standard Oracle operator using ‘▼’, and enter an expression to compare against. Expressions are case sensitive. Use % as a wild card, if needed. You can also select the expression using ‘▼’.
If you filter by ‘Row’, you can create complex WHERE clauses using column aliases and any Oracle functions or operators. Click ‘Apply’ to apply the filter:
Data
Click ‘Data’ within the ‘Actions' dropdown menu. You can sort data, perform mathematical computation on column, add computed column to your report, and perform a flashback query within ‘Data’ menu.

- Sort
It is used to change the columns to sort on and determines whether to sort in ascending or descending order. You can also specify how to handle NULLs. The resulting sorting displays to the right of column headings in the report.

- Aggregate
Aggregates are mathematical computations performed against one column. Click ‘Aggregate’ to get the pop-up window shown below:
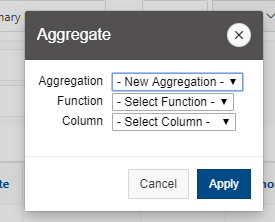
Here, ‘Aggregation’ enables you to select a previously defined aggregation to edit; ‘Function’ is the function to be performed (for example, SUM, MIN); ‘Column’ is used to select the column to apply the mathematical function to. Only numeric columns display.
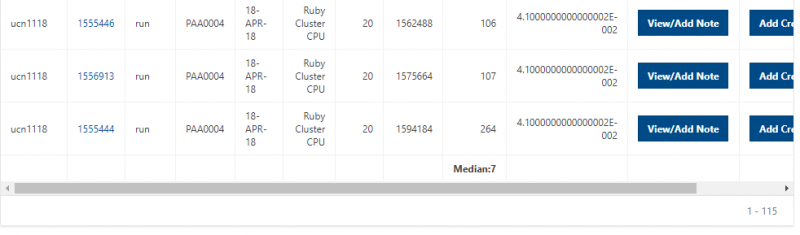
Click the ‘Apply’ button, the aggregates will be displayed at the end of the report within the column they are defined.
- Compute
It enables you to add computed columns to your report. These can be mathematical computations or standard Oracle functions applied to existing columns. Click ‘Compute’ to get the pop-up window shown below:
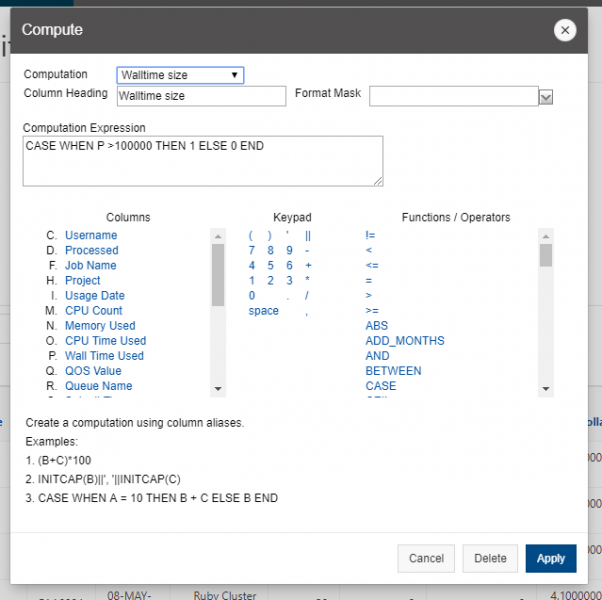
Here, ‘Computation’ enables you to select a previously defined computation to edit; ‘Column Heading’ is the name of this new column displayed in the table; ‘Format Mask’ is an Oracle format mask to be applied against the column; ‘Computation Expression’ is the computation to be performed where columns are referenced using their associated alias. Clicking on the column name or alias includes them in the Computation. Next to Columns is a keypad. This keypad functions as a shortcut to commonly used keys and inserts those keys in the Computation. On the far right are Functions.
Once the computation is defined, click ‘Apply’ button. The computed column will be displayed as the last column of the table.
- Flashback
A flashback query enables you to view the data as it existed at a previous point in time. The maximum amount of time that you can flashback is 7047 minutes.

Format
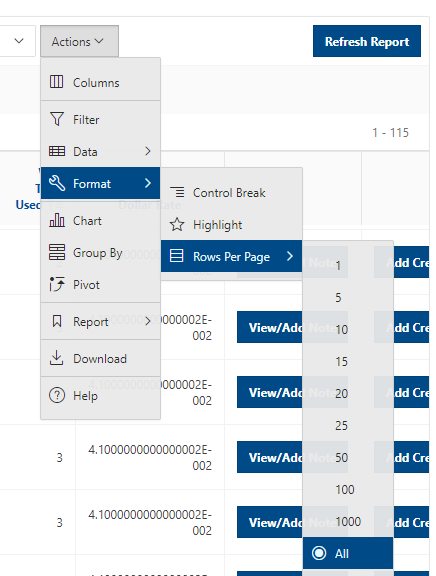
Click ‘Format’ within the ‘Actions' dropdown menu:

Using ‘Format’ menu, you can split the report into multiple groups, highlight the rows that meet the filter, and modify the number of rows listed per page.
- Control Break
It is used to create a break group on one or several columns. Click ‘Control Break’ to get the pop-up window shown below:
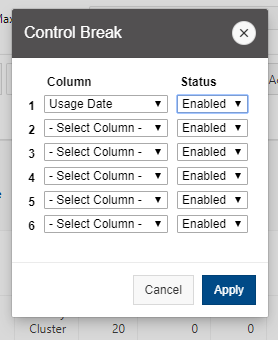
Enable or disable the column for control break. Click ‘Apply’ button. This pulls the columns out of the Interactive Report and displays them as a master record.
- Highlight
It allows you to define a filter. The rows that meet the filter are highlighted using the characteristics associated with the filter. You can highlight the entire row or just the affected cell and can select a new color both for the background and the text. Click ‘Highlight’ to get the pop-up window as below:
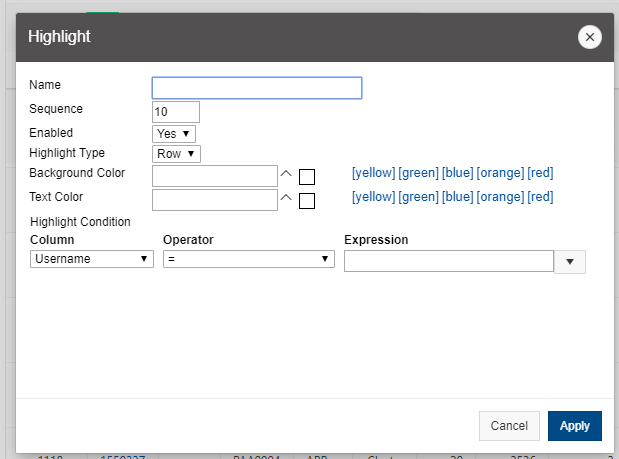
Here, the options include:
- Name: provide a name for this ‘highlight’. Once it is defined, it will be displayed on the top of the table with returned results
- Sequence: identifies the sequence in which the rules are evaluated.
- Enabled: identifies if a rule is enabled or disabled.
- Highlight Type: identifies whether the row or cell should be highlighted. If Cell is selected, the column referenced in the Highlight Condition is highlighted.
- Background Color: is the new color for the background of the highlighted area.
- Text Color: is the new color for the text in the highlighted area.
- Highlight Condition defines the filter condition.
Click the ‘Apply’ button. This pulls the columns out of the Interactive Report and displays the results with defined highlights.
- Rows Per Page
You can select the value to modify the number of rows listed per page.
Data visualization
Different tools are available in client portal for the data visualization, including:
- Chart
- Group By
- Pivot
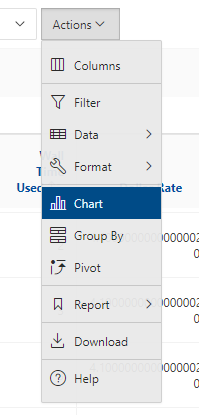
Chart
Click ‘Chart’ to get the pop-up window as below:
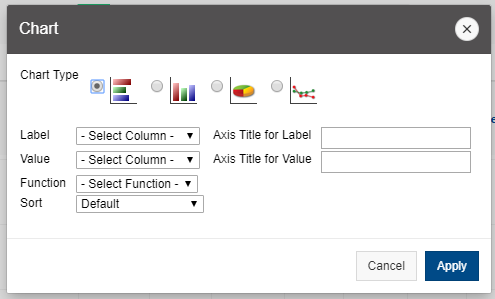
Here, the options include:
- Chart Type: identifies the chart type to include. Select from horizontal bar, vertical bar, pie, or line.
- Label: enables you to select the column to be used as the label.
- Axis Title for Label: is the title that displays on the axis associated with the column selected for Label. This is not available for pie chart.
- Value: enables you to select the column to be used as the value. If your function is a COUNT, a Value does not need to be selected.
- Axis Title for Value: is the title that displays on the axis associated with the column selected for Value. This is not available for pie chart.
- Function: is an optional function to be performed on the column selected for Value.
- Sort: allows you to sort your result set.
Click the ‘Apply’ button. You will get the page in which the chart is generated. You can include one chart per Interactive Report. Once defined, you can switch between the chart and report views using the icons beside ‘Go’:
Group By
Click ‘Group By’ to get the pop-up window as below:
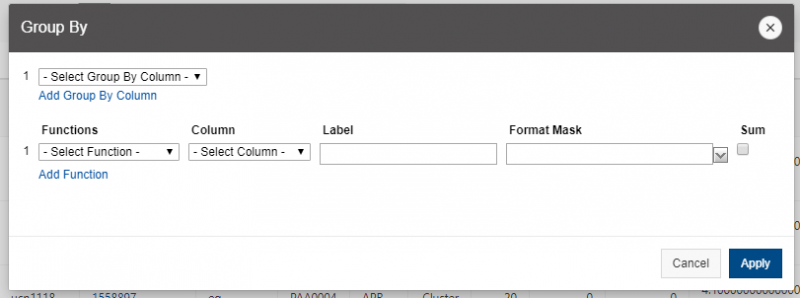
Here, the options include:
- Add Group By Column: the columns on which to group
- Add Function: the columns to aggregate along with the function to be performed
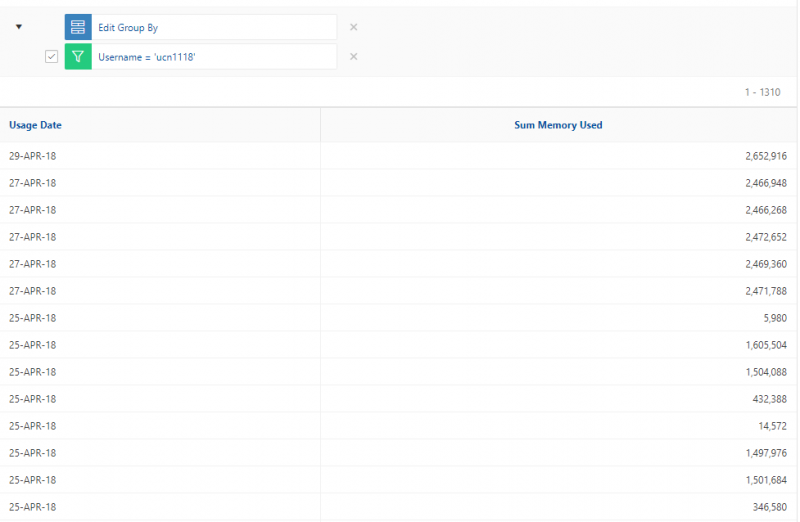
Click the ‘Apply’ button. You will get the page in which the Group By view is generated. You can include one Group By view per Interactive Report. Once defined, you can switch between the Group By and report views using the icons beside ‘Go’:
Pivot
Click ‘Pivot’ to get the pop-up window as below:
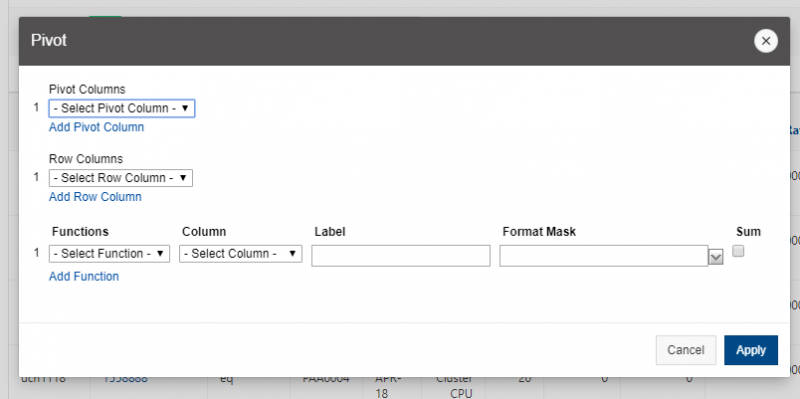
Here, the options include:
- Add Pivot Column: the columns on which to pivot
- Add Row Column: the columns to display as rows
- Add Function: the columns to aggregate along with the function to be performed
Click the ‘Apply’ button. You will get the page in which the Pivot view is generated. Please note that Pivot does not work for very large datasets e.g. ~5000 entries. You can include one Pivot view per Interactive Report. Once defined, you can switch between the Pivot and report views using the icons beside ‘Go’:
Save/Reset report
Within ‘Report’ menu, you can save the customized report for future use, or remove any customizations that you have made and reset the report to the default settings.
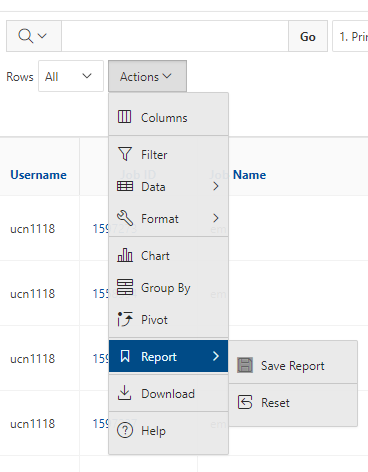
Save Report
‘Save Report’ saves the customized report for future use (it will be there after logging out and back in again). Click Save Report’ to get the pop-up window shown below:

You provide a name and an optional description. For now, all customized reports are private, which means only the end user that created the report can view, save, rename or delete the report. If you save customized reports, a Reports selector displays in the Search bar:

You will be able to choose the reports between ‘Default -> Primary Report’ (which is the report that initially displays) and ‘Private -> Your defined reports’
Reset
‘Reset’ brings the report back to the settings when logged in, removing any customizations that you have made. Click ‘Reset’ to get the pop-up window as below:
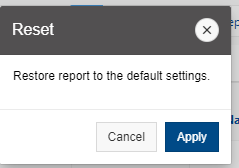
Click the ‘Apply’ to confirm. You can also uncheck the checkbox next to any customization to temporarily disable it or click the ‘x’ icon to remove the customization.
Download
‘Download’ enables the current result set to be downloaded. Click ‘Download’ to get the pop-up window:

The download formats differ depending upon your installation and report definition but may include CSV, HTML, PDF, or Email. Click the icon of the format you wish to download in.
Help
‘Help’ provides you more detailed user guide on ‘Action’ menu.
Example: create a chart report of daily HPC jobs by a user
In this example, I’d like to provide step-by-step instructions for creating a chart report of HPC jobs, in which:
- All jobs submitted by user ‘xwang’
- The data range is from April 29, 2018 to May 7, 2018
- The report shows the total CPU time per day
The following functions will be demonstrated:
- Use simple filter on ‘HPC Job Activity’ page
- Use ‘search’ tool
- Adjust rows to be displayed per page
- Adjust columns to be displayed in the table
- Format the data using ‘Control Break’
- Generate a chart report
- Save report
- Download report
- Click ‘Individual -> HPC Job Activity’
- You will get the ‘HPC Job Activity’ page. Change ‘Minimum Date’ and ‘Maximum Date’ to ‘29-Apr-18’ and ’07-May-18’, respectively. Click “Refresh Report’ to updated the information displayed in the table
- To listed the jobs submitted by user ‘xwang’ only, click ‘Search’ box and choose ‘Username’:
- Type ‘xwang’ in the ‘search’ box and press ‘Enter’.
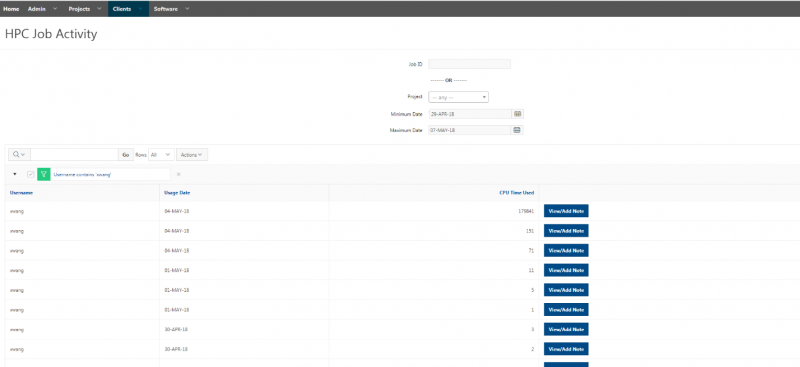
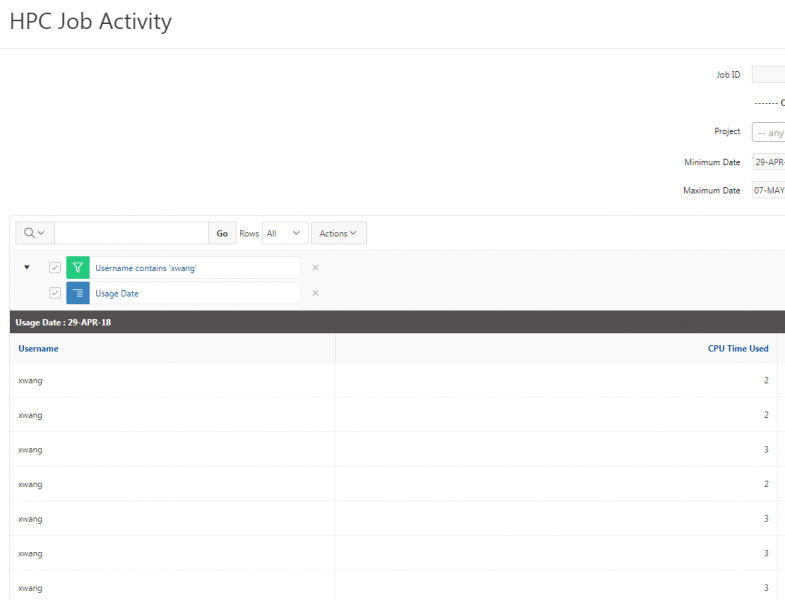
- You will get the table that lists all jobs submitted by user ‘xwang’ between April 29, 2018 and May 7, 2018, with the filter listed above the table. Change the number of rows displayed per page to ‘All’ to list all jobs, as shown below:

- Since we are interested in the daily CPU usage by ‘xwang’, we can remove some columns of the table by clicking the heading of some columns to hide the column. For instance, click ‘Hide Column’ icon in ‘Job ID’, the page will be refreshed automatically. The column ‘Job ID’ will NOT be displayed after refreshing:
- Perform similar operations on other columns. You can also adjust the columns to be displayed by clicking ‘Columns’ within the ‘Actions' dropdown and make ‘Username’, ‘Usage Date’, and ‘CPU Time Used’ to be displayed in the report. The final table is as below:
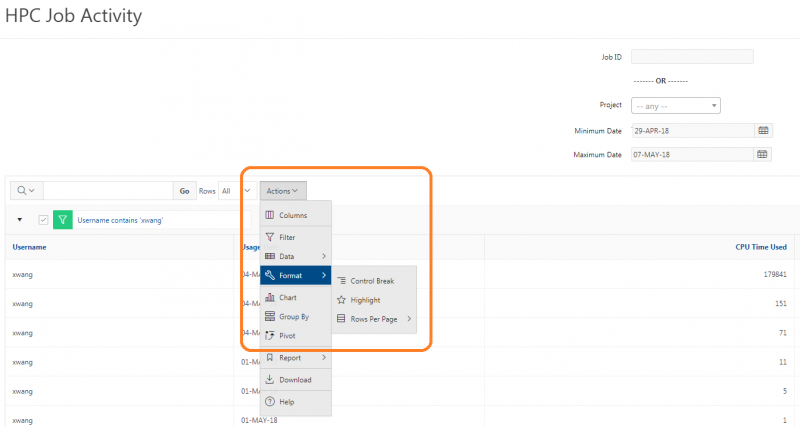
- To create a break group based on ‘Usage Date’, click ‘Actions -> Format -> Control Break’ as shown below:
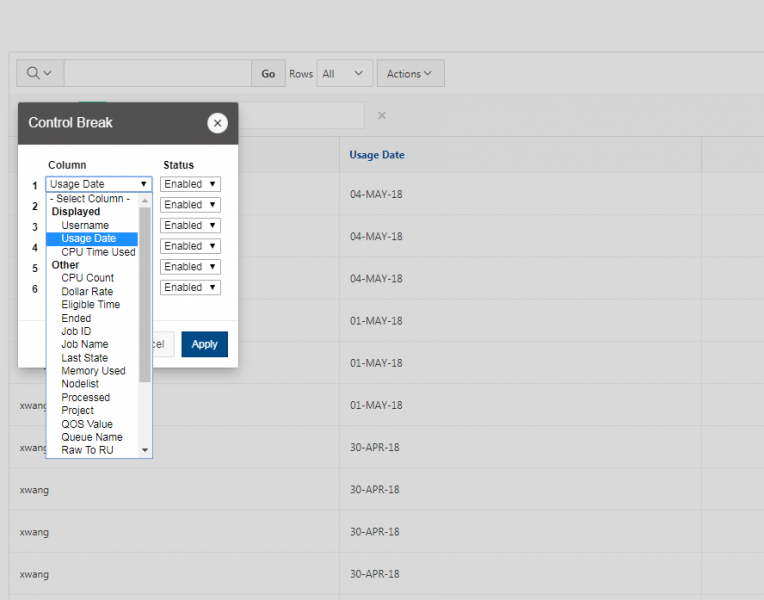
- You will get the ‘Control Break’ pop-up window. Choose ‘Usage Date’ under ‘Column’ with Status ‘Enabled’, as shown below:
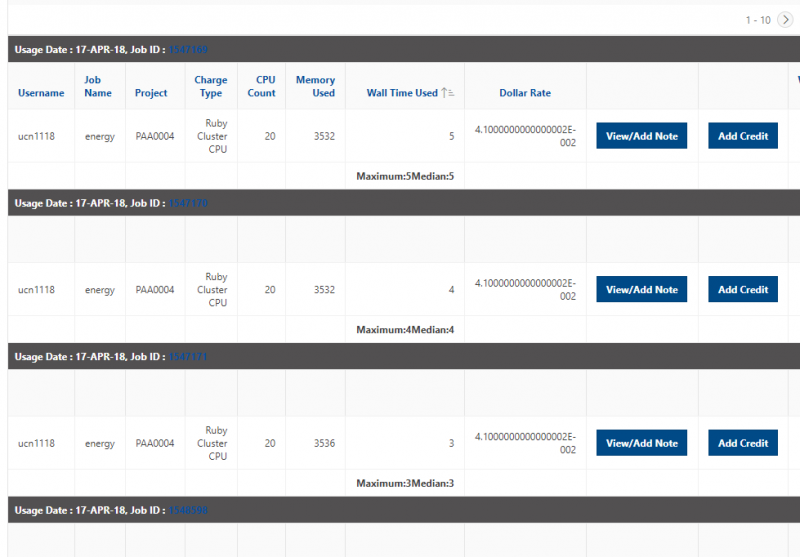
- Click ‘Apply’. This pulls the column ‘Usage Date’ out of the report and the jobs submitted by ‘xwang’ are grouped based on ‘Usage Date’, as shown below:
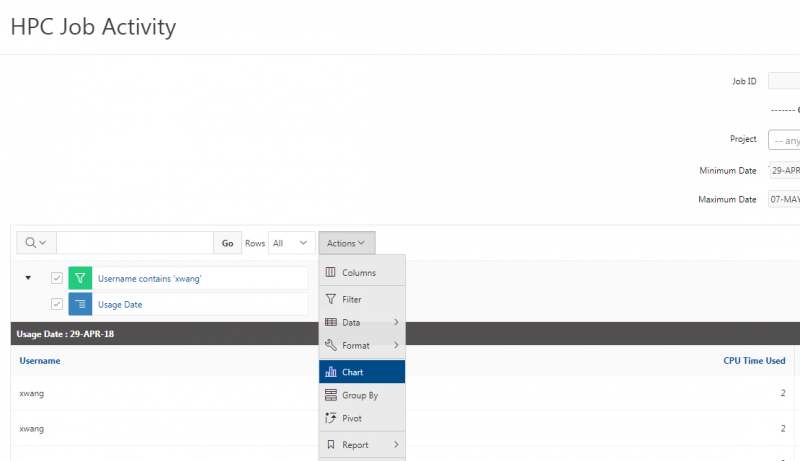
- To generate a chart report that shows the total CPU time per day, click ‘Actions -> Chart’ as shown below:
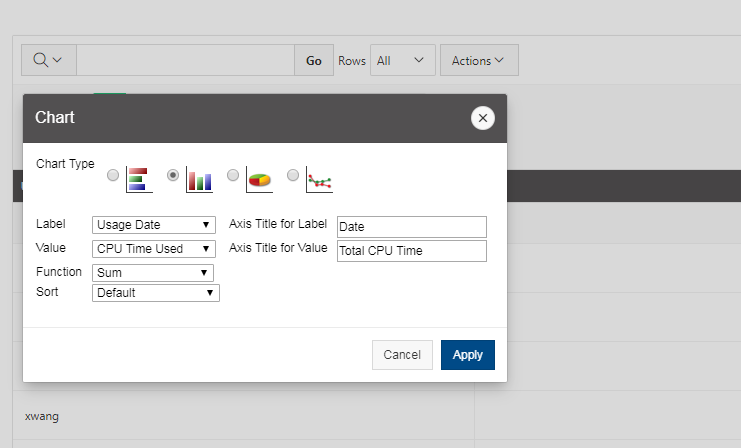
- You will get the ‘Chart’ pop-up window. Using the following information on the chart options, as shown in the image below:
- Chart Type: vertical bar
- Label: Usage Date
- Axis Title for Label: Date
- Value: CPU Time Used
- Axis Title for Value: Total CPU Time
- Function: Sum
- Sort: Default
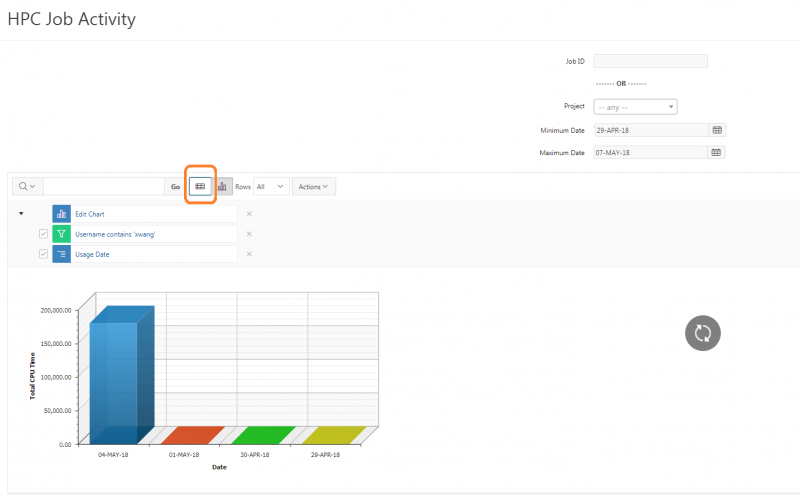
- Click the ‘Apply’ button. You will get the chart report showing the daily total CPU usage by ‘xwang’ between April 29, 2018 and May 7, 2018 (here, the CPU usage is zero if the date is missing in this chart):
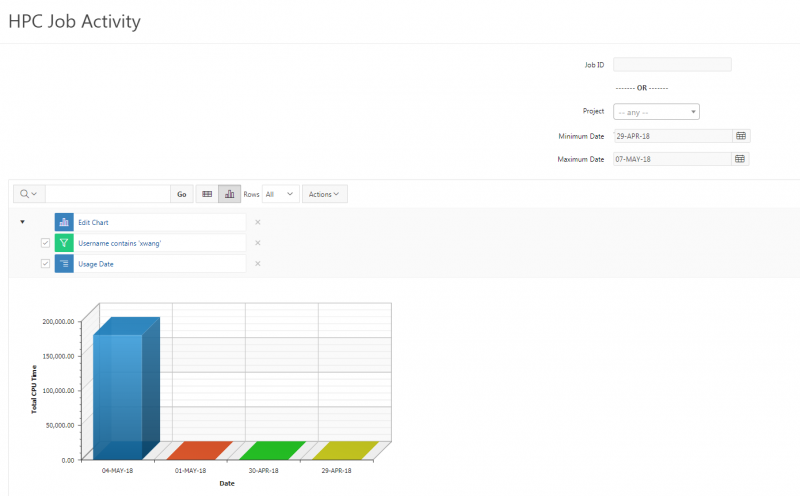
- From this chart, it is easy to see that ‘xwang’ used many CPU hours on May 4th, and very few CPU hours on other days. To switch back to report view, you can click the icon ‘View Report’ to the left of the row selection:
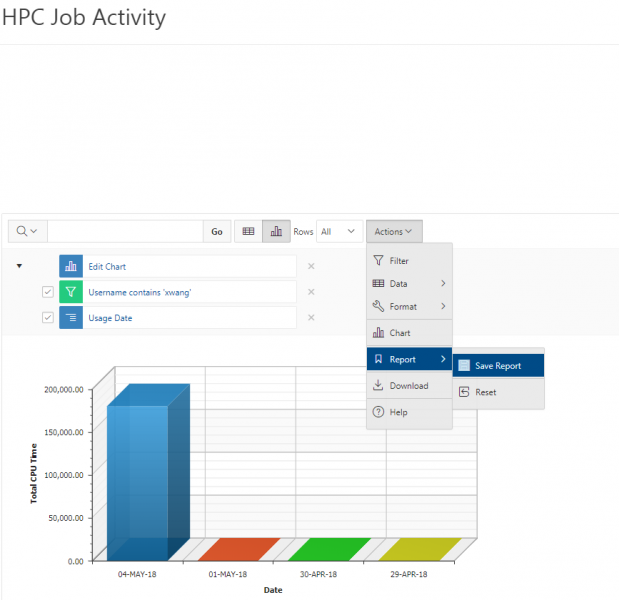
- You can save this report for future use by clicking ‘Actions -> Report -> Save Report’ as shown below:
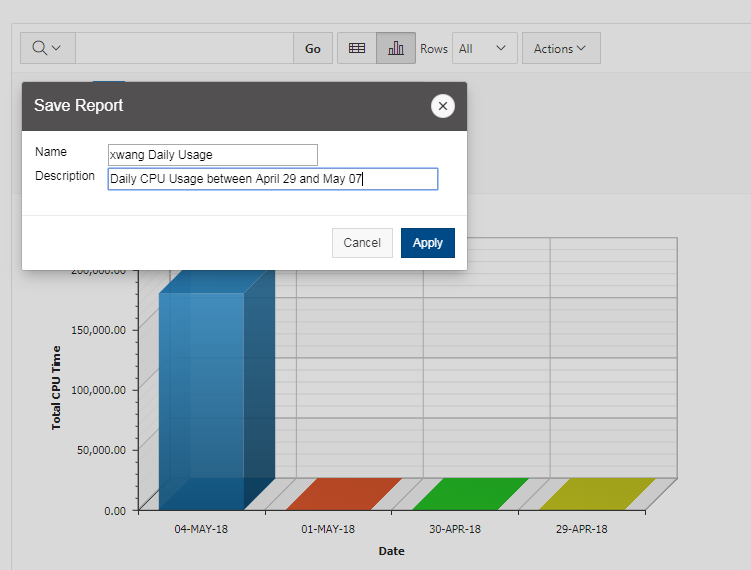
- You will get the ‘Save Report’ pop-up window. Provide ‘xwang Daily Usage’ as the name and ‘Daily CPU Usage between April 29 and May 07’ as Description, as below:
- Click ‘Apply’ button to save the report. Now, beside ‘Go’, you will be able to choose the reports between ‘Default -> Primary Report’ (which is the report that initially displays) and ‘Private -> xwang Daily Usage’, as shown below:
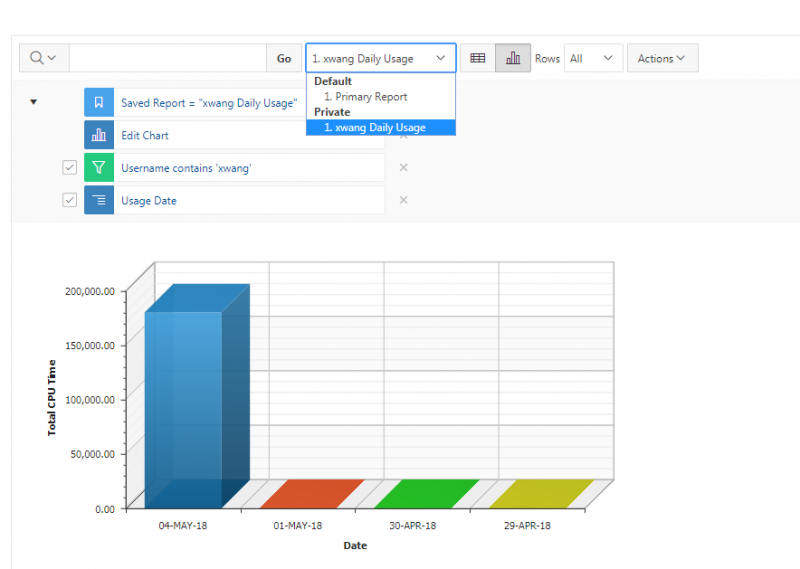
- For now, all customized reports are private, which means only the end user that created the report can view, save, rename or delete the report.
- You can download this report by clicking ‘Actions -> Download’ as shown below:

- You will get the ‘Download’ pop-up window as below:
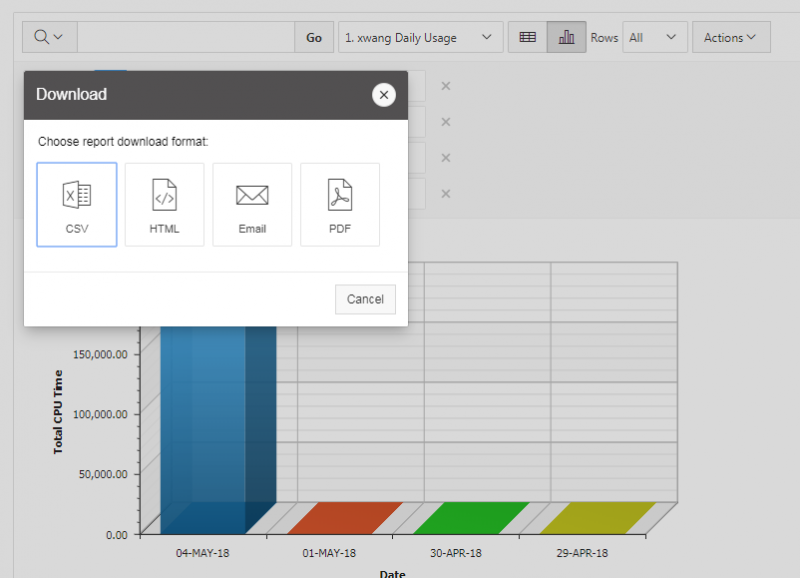
- Click the icon of CSV, HTML, or PDF to download this report, or click the icon of Email to email this report to the desired recipient. Please note the downloaded report is in the format of table only, while other formats like ‘Chart’ won’t be available for downloading.