The XDMoD tool at xdmod.osc.edu can be used to get an overview of how accurate the requested time of jobs are with the elapsed time of jobs.
To request an amount of time for a job, you can use the following header.
#SBATCH --time=xx:xx:xx
The elapsed time is how long the job ran for before completing. This can be obtained for completed jobs using the sacct command.
$ sacct -u <username> --format=jobid,account,elapsed
It is important to understand that the requested time is used when scheduling a submitted job. A longer requested time will also increase the wait time, as it will take longer to reserve the requested resources for that amount of time. This makes getting the requested job time as close to the expected elapsed time important for minimizing wait times.
The above method of checking elapsed time allows one to view the requested time accuracy for an individual job, but XDMoD can be used to do this for jobs submitted over a specified period of time.
First, login to xdmod.osc.edu. (See this page for more instructions.)
https://www.osc.edu/supercomputing/knowledge-base/xdmod_tool
Then, navigate to the Metric Explorer tab.
Look for the Metric Catalog on the left side of the page and expand the SUPREMM options. Select Wall Hours: Requested: Per Job and group by None.
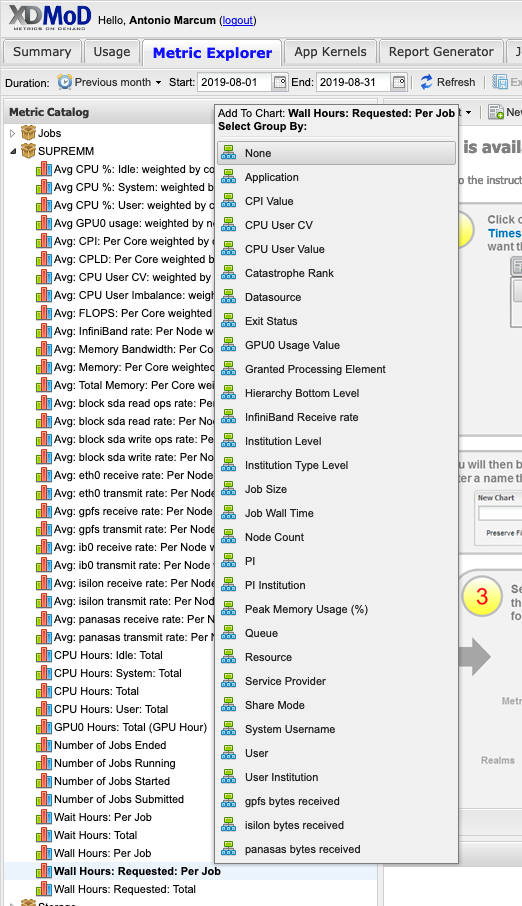
This will now show the average time requested.
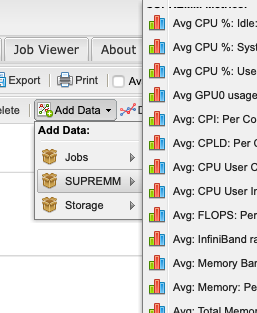
The actual time data can be added by navigating to Add Data -> SUPREMM -> Wall Hours: Per Job.
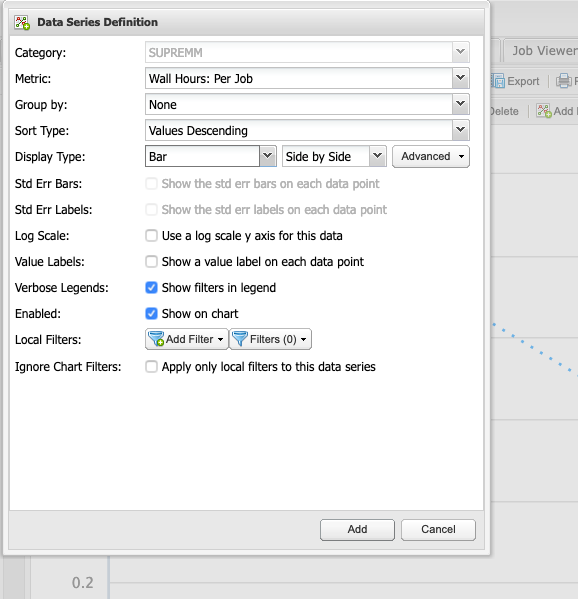
This will open a new window titled Data Series Definition, to change some parameters before showing the new data. In order to easily distinguish between elapsed and requested time, change the Display Type to Bar, then click add to view the new data.
Now there is a line showing the average time requested by submitted jobs, and bars depicting the average time that elapsed to complete those jobs. Essentialy, the closer the bar is to the line, without intersecting the line, the more accurate the time predicition. If the bar intersects the line, then it may indicate the there was not enough time requested for a job to complete, but remember that these values are averages.
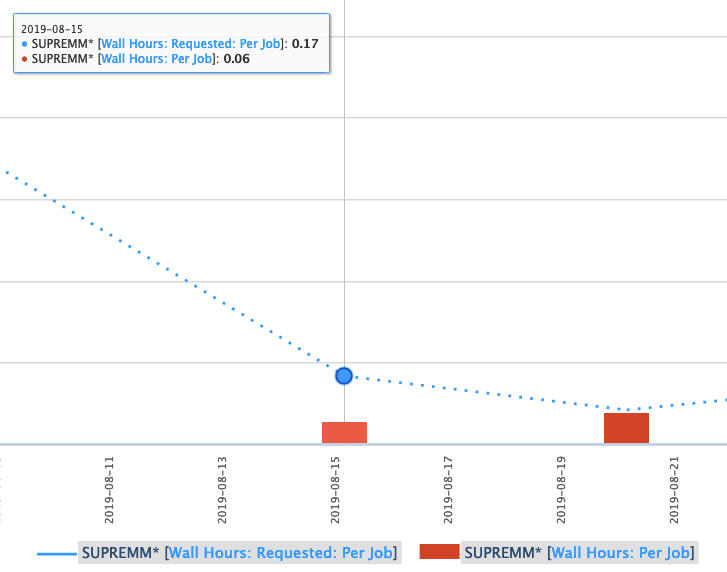
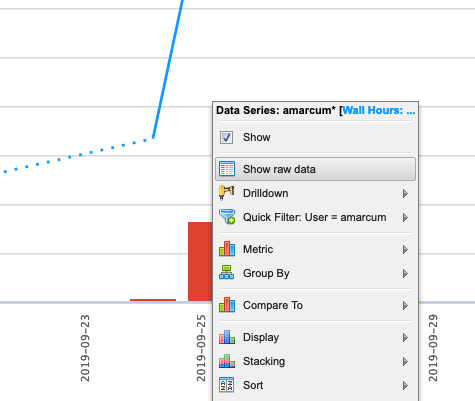
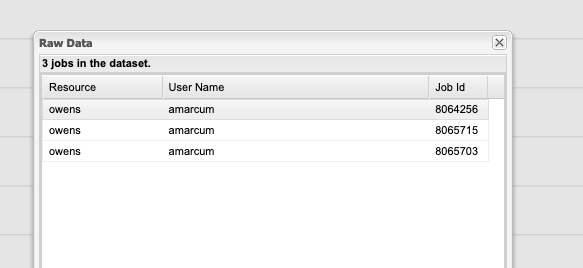
One can also view more detailed information about these jobs by clicking a data point and using the Show raw data option.