Overview
Estimating GPU memory (VRAM) usage for training or running inference with large deep learning models is critical to both 1. requesting the appropriate resources for running your computation and 2. optimizing your job once it is setup. Out-of-memory (OOM) errors can be avoided by requesting appropriate resources and by better understanding memory usage during the job using memory profiling tools described here.
Estimating GPU Memory Usage for Inference
Estimated GPU VRAM in GB = 2x model parameters (in billions) + 1x context length (in thousands)
For example, for StableCode with 3 billion parameters and 16k context length, we estimate 6GB for model weights + 16GB for overhead, totaling 22 GB estimated to run inference. A model like this should fit on an A100 or H100 for inference.
This estimate assumes fp16 (half-precision). Quantization to lower precisions (8-bit, 4-bit, etc) will reduce memory requirements.
Estimating GPU Memory Usage for Training
Estimated GPU VRAM in GB = 40x model parameters (in billions)
For example, for LLaMA-3 with 7 billion parameters, we estimate minimum 280GB to train it. This exceeds the VRAM of even a single H100 accelerator, requiring distributed training. See HOWTO: PyTorch Fully Sharded Data Parallel (FSDP) for more details.
Of note, the training estimate assumes transformer-based architecture with Adam optimizer using mixed-precision (32bit and 16bit weights used) and is extrapolated from results here: Microsoft Deepspeed.
Activation checkpointing can reduce the memory demands, at the cost of increasing runtime.
Example GPU Memory Usage for Selected Models
| Model Name | Parameter count (billions) | Training / Inference | Batch Size | Context Length | min GPUs required | GPU Memory Usage (GB) |
|---|---|---|---|---|---|---|
| minGPT (GPT-2) | 0.12 | training | 216 | 1 V100 (16GB) | 9 | |
| T5 (small) | 3 | training | 4 | 1 H100 (94GB) | 81 | |
| T5 (medium) | 11 |
training |
4 | 8 H100s (94GB) | 760 | |
| Stable-Code-3b | 3 | inference (vllm) | 256 | 16k | 1 A100 (40GB) |
Model weights: 6GB Total usage: 7 (eager mode with 1k context length, 0.18 gpu), 10 (eager mode with 10k context length, 0.25 gpu), 14 (using 0.37 gpu), 20 (using 0.5 gpu), 36 (using 0.9 default gpu) |
| Falcon-7b-Instruct | 7 | inference (vllm) | 256 | 2k | 1 A100 (40GB) |
Model weights: 13GB Total usage: 15 (using 0.37 gpu), 20 (using 0.5 gpu), 36 (using 0.9 default) |
| CodeLlama-13b-Instruct-hf | 13 | inference (vllm) | 256 | 10k | 1 A100 (40GB) |
Model weights: 25GB |
| Gemma3:12b | 12 | inference (Ollama) | 512 | 2k | 1 V100 (16GB) | 11 |
Training memory usage was obtained from Prometheus data. Inference usage was measured with nvidia-smi and vllm or Ollama. Training usage generally follows the estimates above. Inference usage varies considerably depending on parameter size, context length and dtype precision. Vllm also uses a pre-allocation strategy which can increase estimated usage if left at its default 0.9. Eager mode vs CUDA graph mode trades memory footprint for speed.
Profiling GPU Memory Usage During Computation
There are a number of tools that can be used to gather more information about your job's GPU memory usage. Detailed memory usage can be helpful in debugging and optimizing your application to reduce memory footprint and increase performance.
GPU Usage script
The get_gpu_usage script is available on all OSC clusters. Start with this usage script to determine the maximum memory requirements of your job. Once your job has completed, provide the SLURM job ID (and optionally cluster name) to get the maximum memory usage on each GPU used on your job. For example,
$ get_gpu_usage -M cardinal 477503
Host c0813 GPU #0: 19834 MB
Host c0813 GPU #1: 33392 MB
Host c0813 GPU #2: 28260 MB
Host c0813 GPU #3: 28244 MB
Host c0823 GPU #0: 19808 MB
Host c0823 GPU #1: 33340 MB
Host c0823 GPU #2: 28260 MB
Host c0823 GPU #3: 28244 MB
Nvidia-smi Usage
nvidia-smi is a command-line tool available on all GPU-enabled compute nodes that lists processes and their GPU memory usage. Without any arguments, the output looks like the following:
[username@p0254 ~]$ nvidia-smi
Wed Nov 13 20:58:25 2024
+-----------------------------------------------------------------------------------------+
| NVIDIA-SMI 550.90.12              Driver Version: 550.90.12      CUDA Version: 12.4     |
|-----------------------------------------+------------------------+----------------------+
| GPU  Name                 Persistence-M | Bus-Id          Disp.A | Volatile Uncorr. ECC |
| Fan  Temp   Perf          Pwr:Usage/Cap |           Memory-Usage | GPU-Util  Compute M. |
|                                         |                        |               MIG M. |
|=========================================+========================+======================|
|   0  Tesla V100-PCIE-16GB           On  |   00000000:3B:00.0 Off |                  Off |
| N/A   27C    P0             37W /  250W |   13830MiB /  16384MiB |      0%      Default |
|                                         |                        |                  N/A |
+-----------------------------------------+------------------------+----------------------+

+-----------------------------------------------------------------------------------------+
| Processes:                                                                              |
|  GPU   GI   CI        PID   Type   Process name                              GPU Memory |
|        ID   ID                                                               Usage      |
|=========================================================================================|
|    0   N/A  N/A     27515      C   .../vllm_env/bin/python                     13818MiB |
+-----------------------------------------------------------------------------------------+
The example output above shows a V100 on a Pitzer compute node running a vllm inference server running a 3 billion parameter model and using about 14GB of GPU memory.
Summary statistics are available at the top, showing the GPUs available and their current and max memory available. Below, all running processes are shown, with the relevant GPU, PID, Process name, and GPU Memory Usage for that process.
The tool will show multiple GPU devices on the same node if more than one is available, but is limited to one node.
Additional arguments are available, as described in the official documentation.
To run nvidia-smi on the correct node, you will need to ssh to the node where your job is running. You can find the node hostname using the squeue command:
[username@pitzer-login02 ~]$ squeue -u username
             JOBID PARTITION     NAME     USER   ST       TIME  NODES NODELIST(REASON)
          32521417 gpudebug- interact   username  R       0:38      1 p0254
where "username" is your username. In the example above, "p0254" is the compute node you need to run the tool on. The jobid is also useful for other monitoring tools. See HOWTO: Monitoring and Managing Your Job for more details.
Grafana Dashboard Metrics
Grafana provides a dashboard that shows a timeline of GPU memory and usage over time during your job. The script job-dashboard-link.py
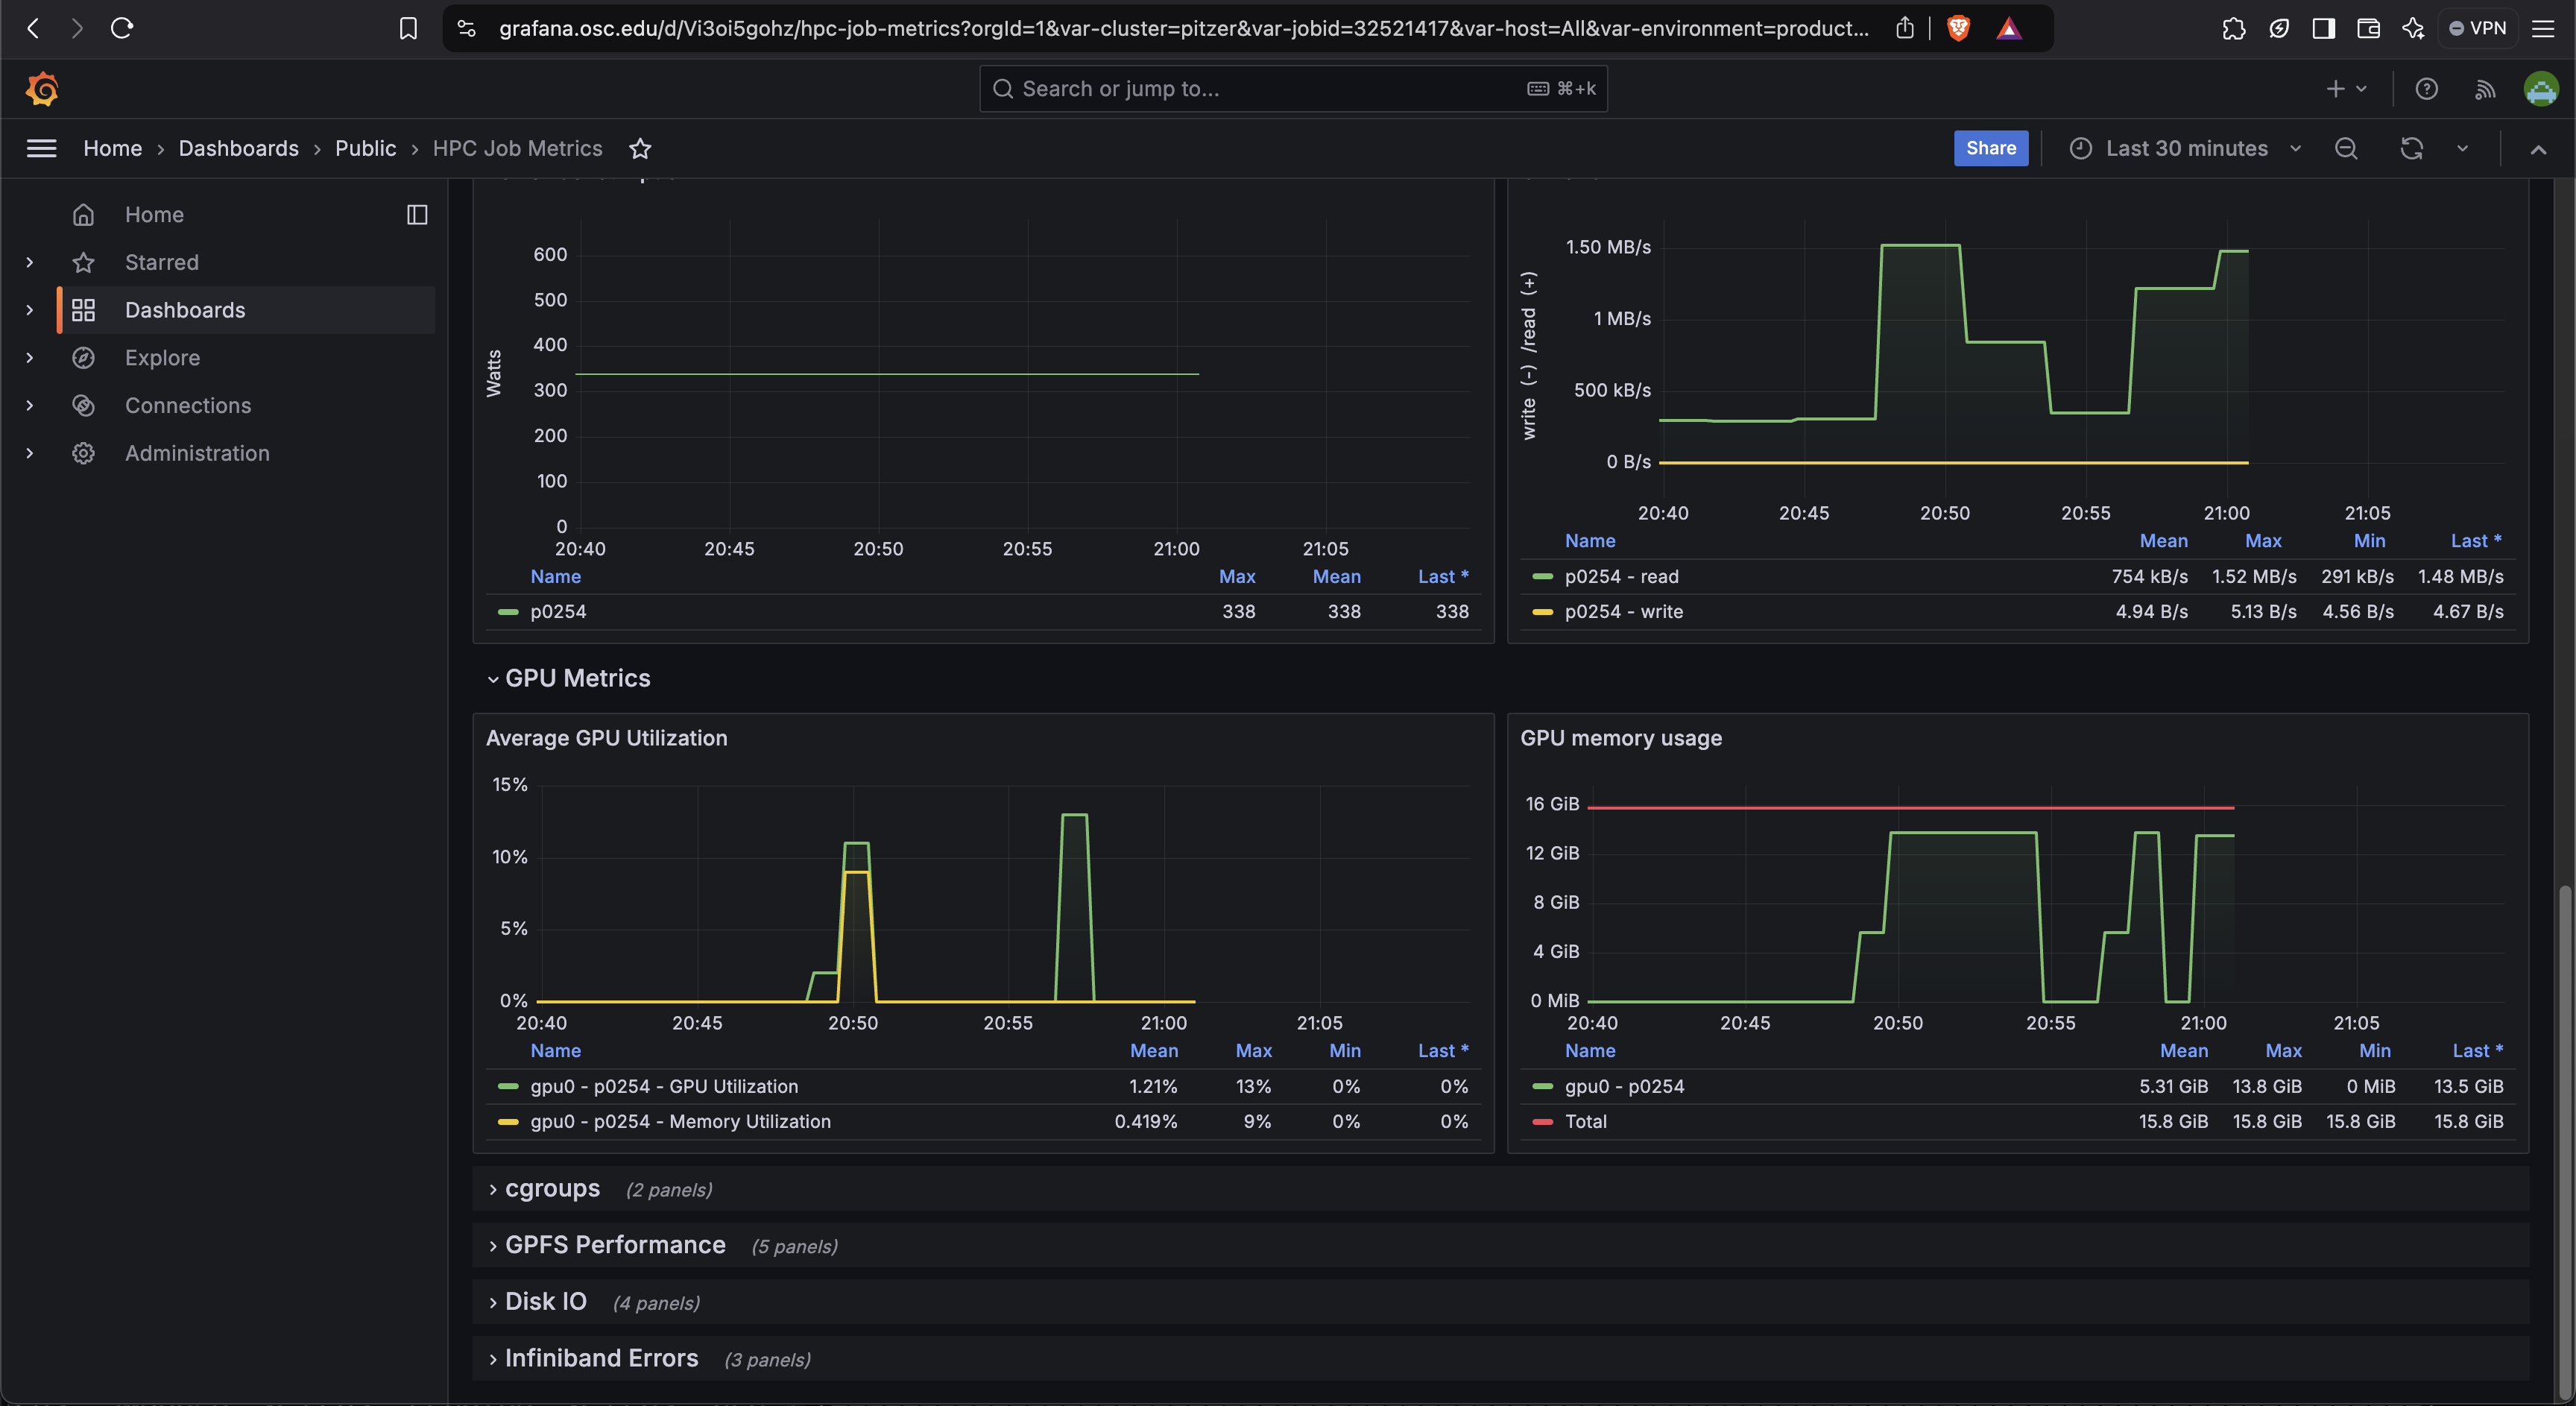
This can give you an idea of when in your job the memory usage peaked and how long it stayed there.
PyTorch memory snapshotting
This tool requires the following minor modifications to your code
- Start:
torch.cuda.memory._record_memory_history(max_entries=100000) - Save:
torch.cuda.memory._dump_snapshot(file_name) - Stop:
torch.cuda.memory._record_memory_history(enabled=None)
This creates a trace file that can viewed by using the javascript code available here. This trace contains information about which called memory allocations and deallocations. This information is sufficient in most cases to understand the memory behavior of your applications. The following two tools can be used to provide additional information, but are only recommended for advanced users.
See documentation here for more information on how to snapshot GPU memory usage while running PyTorch code.
PyTorch Profiler
"PyTorch Profiler is a tool that allows the collection of performance metrics during training and inference. Profiler’s context manager API can be used to better understand what model operators are the most expensive, examine their input shapes and stack traces, study device kernel activity and visualize the execution trace."
The PyTorch profiler also requires code modifications. It provides a suite of configuration options for what information to track and how to export it. The overhead (both in terms of slowing down your job and the size of the profile files) can get very large. There are multiple ways to view the profile data (tensorboard, HTA, chrome browser, etc). At time of writing (2/18/25), tensorboard support has been officially deprecated while HTA is still experimental.
See PyTorch Profiler documentation here.
Here is an example walkthrough using both tools.
NVIDIA Nsight Systems
This profiler provides detailed hardware-level information about what the GPU did during your job. It can be challenging to map hardware events to user-level functions when using Nsight, particularly for Python-based codes. This is only recommended for advanced users. Documention from NVIDIA on how to use Nsight Systems is available here. To learn how to use NVIDIA Nsight Systems at OSC, see the NVHPC page.
Solving GPU Out-of-Memory Errors
While there is no one-size-fits-all solution to solving OOM errors, here are a few guidelines on how to reduce GPU memory usage. If you require assistance, please contact OSC Support.