Gateways
We provide a number of web portals to help our user community easily access and manage computing resources. This guide lists portals of general interest to most OSC clients as well as domain-specific portals. OSC staff also can offer suggestions for more specialized research portals.
General Interest for Most Clients
OSC OnDemand
OSC OnDemand is our "one stop shop" for access to our High Performance Computing resources. With OnDemand, you can upload and download files, create, edit, submit, and monitor jobs, run GUI applications, and connect via SSH, all via a web broswer, with no client software to install and configure.
Access OnDemand | Documentation
Client Portal
The client portal provides access to OSC's accounting and account management infrastructure. Change your password, update contact information, submit budget requests, manage access to research projects, run custom reports, and report funding and publications relevant to your use of OSC services.
Access Client Portal | Documentation
XDMoD
XDMoD, which stands for XD Metrics on Demand, is an NSF-funded open source tool that provides a wide range of metrics pertaining to resource utilization and performance of high-performance computing (HPC) resources, and the impact these resources have in terms of scholarship and research.
Grafana
Query, visualize, alert on and understand your data no matter where it’s stored. With Grafana you can create, explore and share all of your data through a flexible dashboard.
Access Grafana | Documentation
Domain-specific Portals
WebMO
WebMO is a free web-based interface for computational chemistry packages, improving the accessiblity and usability of the software.
Opacity Project
This international collaboration was formed to calculate the extensive atomic data required to estimate stellar envelope opacities and to compute Rosseland mean opacities and other related quantities.
Access Opacity Project | Documentation
phylogatR
Phylogatr brings together genetic data with georeferenced specimen records that are analysis-ready. Analyze the data on the OSC clusters using R scripts or R Shiny apps provided by the phylogatr team.
Access phylogatR | Documentation
Examples of Other Specialized Portals
- BISR (Biomedical Informatics Shared Resource)
- CryoSPARC
- OSUNDA (The Ohio State University resource)
- CATS (Covid-19 Analytics and Targeted Surveillance System)
- Human Genetics Data Management Platform
Please contact OSC Help if you would like to learn more about any of the above.
Client Portal
The url of the OSC client portal is https://my.osc.edu. Please log into it using your current OSC HPC username and password.
Overview
OSC client portal is a full replacement of OSC’s accounting and account management infrastructure (including my.osc.edu and app.osc.edu). It maintains the ability to change your password and contact information as well as submit budget requests, but much is being added. A partial list includes:
- Self-signup for accounts
- PIs or their designates can manage user access to research projects
- Ability to report funding and publications relevant to your use of OSC services
- Ability to run custom reports on usage and annotate jobs
See the navigation sections, one below and one on the right side of the page, for some guides on using the client portal.
Self-Signup for Accounts
Self-Signup for Accounts
1. Navigate to MyOSC, our client portal.
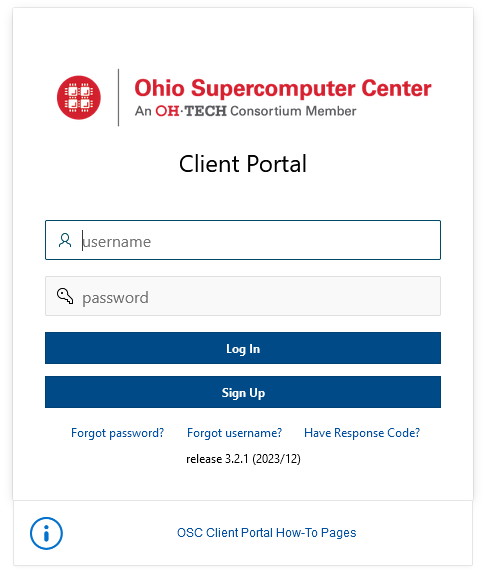
2. Click the "Sign Up" button and submit the form.
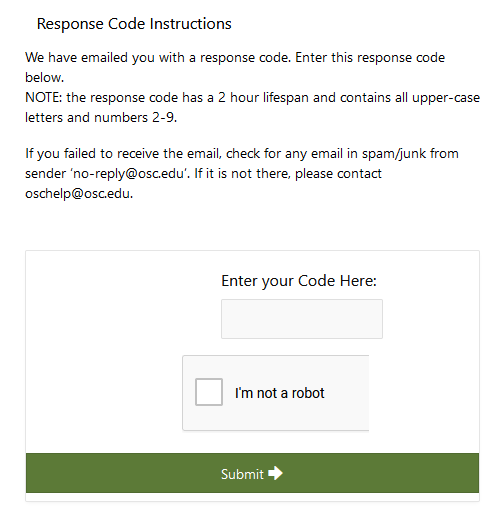
3. Enter the response code.
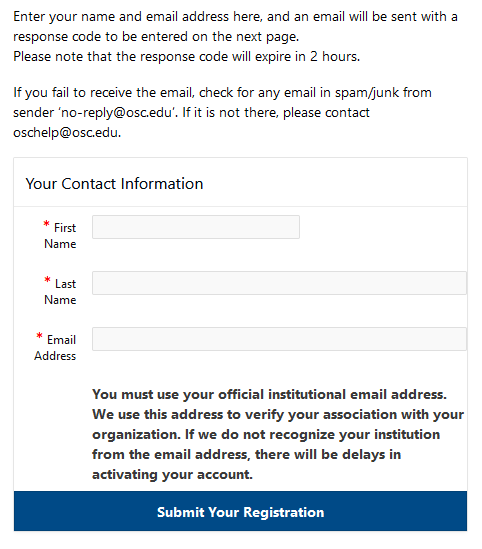
4. The user registration page will be displayed. Please follow the instructions on the page and also fill it out as completely as possible.
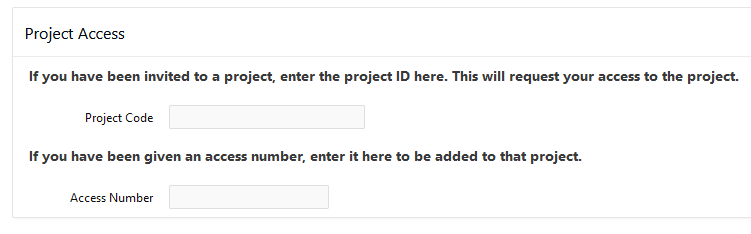
If your PI has provided you with a project and/or access code, please enter that information in the correct box. If the project code is provided, you will be added to the project after the PI or Project Admin accepts your request. If both the project code and corresponding access code are provided, you will be added to the project as soon as the sign-up process is complete.
Once all required information is entered, hit the save button to submit the registration.
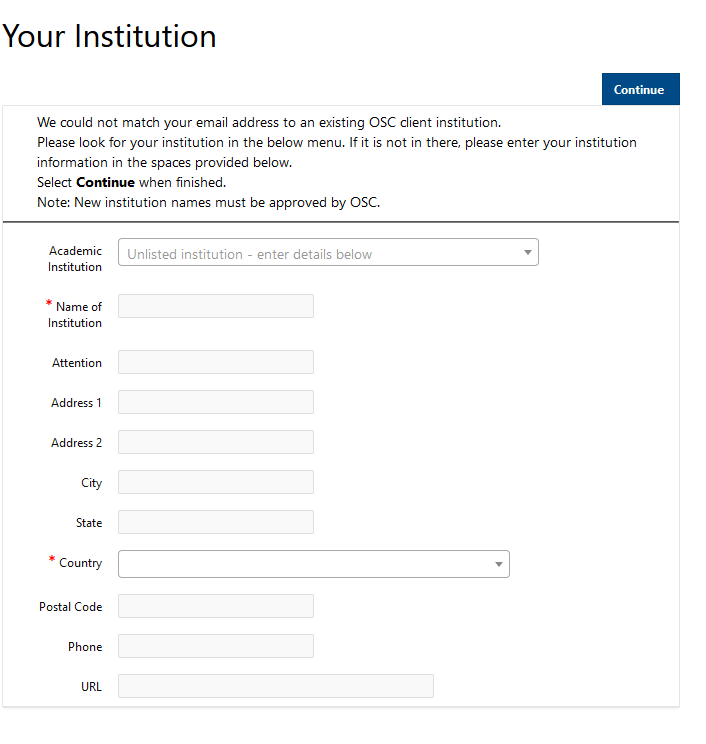
Use the search box to find the appropriate academic institution. If it is not found or you are from a non-academic institution, enter the institution credentials.
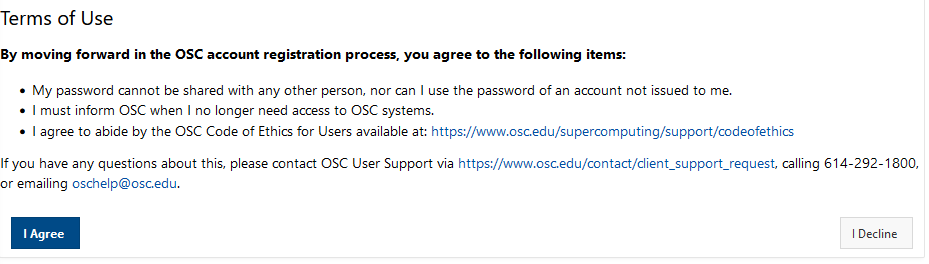
5. You now need to accept or decline our terms of use.
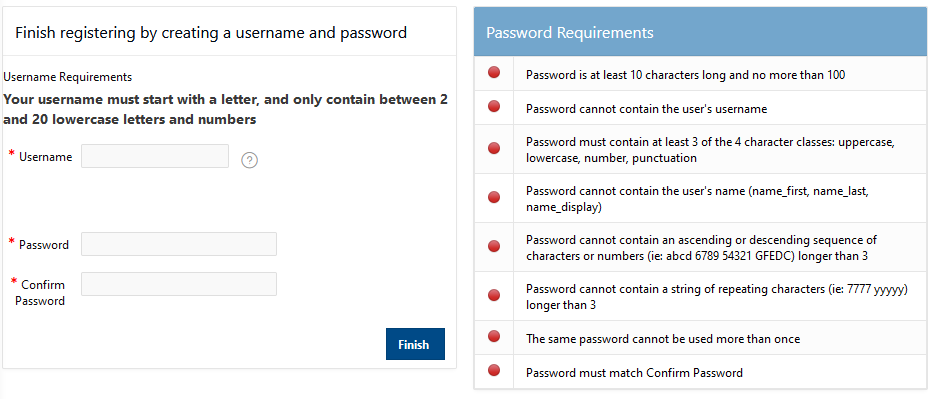
6. If you agree, you can create your username and password. You will not be able to enter the "Confirm Password" section until all of the requirements on the right-hand side are fulfilled (pips will turn green).
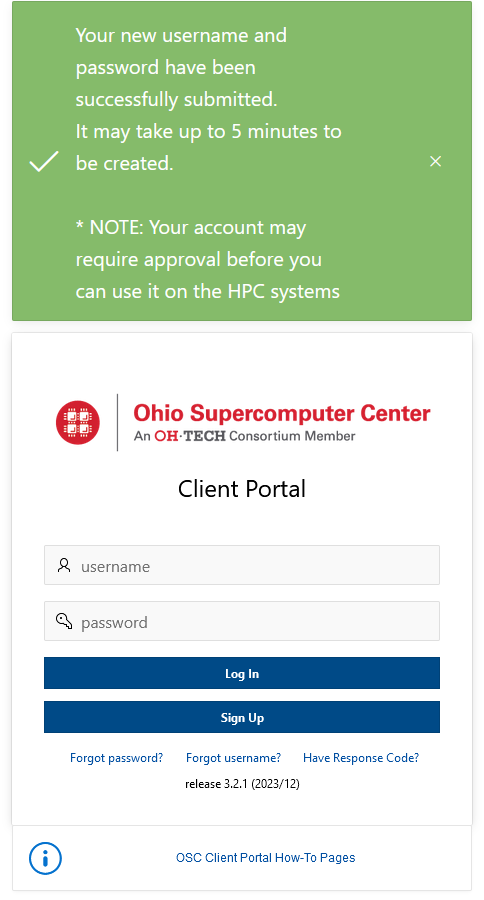
7. Once a username and password are created and saved, there is a redirect back to the login page. The login page will also have a pop-up stating that the username and password have been successfully created.
Change or Reset Password and Retrieve Usernames
Client portal password and username options
Please visit MyOSC, our client portal website.
Change password while already logged in
Click "Change Password" from the dropdown menu in the upper-right corner where the full name of the user is shown.
A successful password change redirects back to the dashboard page. There is also a message displayed confirming the change and providing other information.
Reset an expired or forgotten password
From the Login page, click the "Forgot your password?" link.
Enter a valid username and click the "Submit" button. You will be taken to the response code validation page. An email will be sent to the email address associated with that username with the response code to be entered. The email will be sent from "no-reply@osc.edu." All folders should be checked, including spam/junk. If you did not receive this email, please contact OSC Help.
Obtain OSC usernames
To obtain all the usernames associated with an email address, click "Forgot your username?" and enter a valid email address.
This will send an email containing all the associated usernames with the email address entered. The email will be sent from "no-reply@osc.edu." All folders should be checked, including spam/junk. If you did not receive this email, please contact OSC Help.
Adding grant information
There are different requirements for being able to charge OSC usage towards a grant. This page aims to provide general guidelines, but actual requirements may be different. Contact OSC help if there are specific questions/needs.
Adding grant information
First, the grant information should be added to a user's profile. Login into my.osc.edu and visit the Contact Profile page for the account by clicking the name of the account in the upper-right corner of the page and selecting Edit My Profile.
On this page, click the button Funding, then on the next page click Add New Contact Funding. Enter the appropriate information for the grant and save it.
If a specific funding source is not available, a new one can be created using Individual -> Funding -> Funding Sources, then select Request New Funding Source. This will inform OSC staff to add the new funding source as an option once reviewed.
Use job names
When submitting jobs, make sure to designate the job name to reflect which grant this job applies to.
One can specify the job name at submission time: $ sbatch -J grant_1234 job.sh
Or add a line to the job script: #SBATCH -J grant_1234
This name will be saved with the job record, associating it with the grant specified.
Add a Grant per project
Some grants have strict requirements, and the best way to associate usage for that grant is with a single project, separate from other OSC project's usage. This way, every job associated with a specific project code e.g. PAS1234, will also be implicitly associated with a specific grant.
Visit the project details page for the project that should have grant information added. Click the button External Funding. Select the appropriate grant which should have been added to the PI's profile as in the Adding grant information section above, and click the Add to this project button.
Check usage costs for current fiscal year
It is useful to take a look at usage over periods of time and calculate overall usage at osc. This page explains how to do this using the HPC Job Activity tool in my.osc.edu
After logging into the client portal, navigate to Individual -> HPC Job Activity.
Enter the appropriate dates:
min date: 01 July 2020
max date: current date (or other end date)
Once the dates are entered, the click the button Refresh Report.
It will then produce a table with all the job records within that timeframe.
Group the records together
Select Actions -> Group by
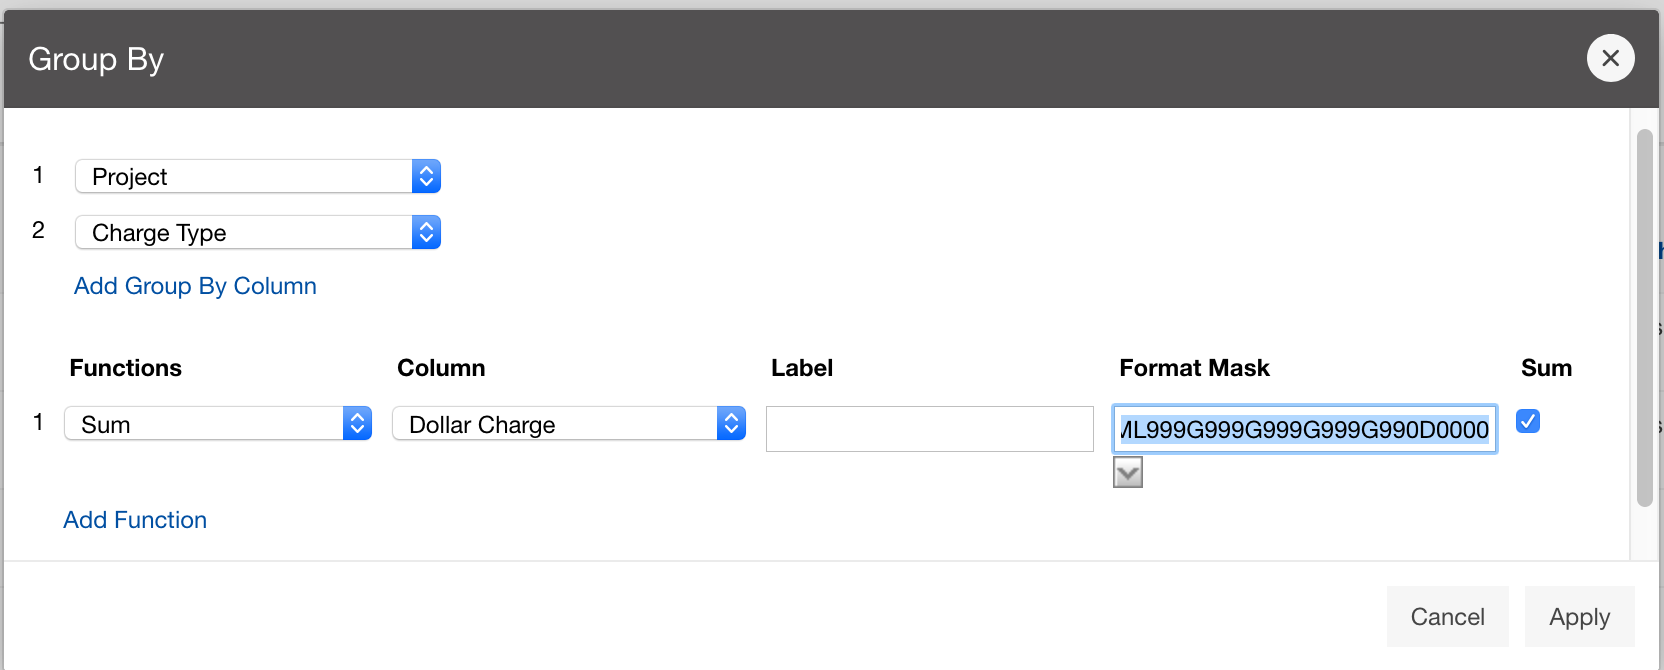
In the drop-down box with text - Select Group by Column - , select Project.
Directly under this, click Add Group by Column and select Charge Type.
Next, use the Sum function with the Dollar Charge column.
Finally, select a format mask and check the sum box on the end of the row.
e.g. FML999G999G999G999G990D0000 will give a dollar amount to the nearest ten-thousandth instead of the deafult hundreth (there are two extra zeroes on the end in the string above).
See the following screenshot to verify the setup:
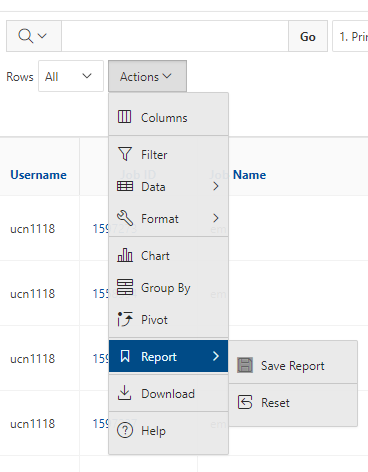
Actions -> Report -> Save Report
Export reports
The reports created above can also be saved locally as a csv. Select Actions -> Download and click the available format to download.
Invite, add, remove users
Manage users on a project
The PI of a project can manage the users on their projects. Note, that PIs are not automatically added as authorized users under their project(s).
Managing users on the project includes inviting, adding and removing users to the project as well as increasing a user's privileges on a project so that they can assist with the management of it.
To manage a project, navigate to Project -> List Projects and select the blue button on the left of the appropriate project.
Adding users
Users can be added to the project by visiting the project details page and selecting the Project Users button. If the user already has an OSC account, then go to Current Project Members -> Add Project User and search them by display name or username. If the user does not have an OSC account, then they can be sent an invitation to sign up for an account and be immediately added to the project by going to Member Invitations -> Invite New User. An email will be sent from "no-reply@osc.edu" - all folders should be checked, including spam/junk. If they did not receive this email, please contact OSC Help.
Approving users
A user may request access to a project, which then needs approved by the PI or a project admin. Navigate to the project details page and select the Project Users button. Expand Current Project Members. Click the blue button next to a username that shows PI approved as no. Set to yes and save. The user should now be approved as a member of the project.
Setup project access number
A user can automatically add themselves to a project if they have the project code and a valid project access number.
The PI or project admin can create a project access number from the project details page using the project access number section and clicking the 'add/replace' button.
The project access number default to be valid only for 14 days. It can be set for less, but 14 is the maximum.
Users may either enter this project access number at sign up or if they already have an account, login and navigate to Project -> Project Access Request. If signing up for an account, an email will be sent from "no-reply@osc.edu" - all folders should be checked, including spam/junk. If they did not receive this email, please contact OSC Help.
Invite users
From your project details, navigate to Current Project Members -> Member Invitations -> Invite New User. Fill in the information and send invite. After complete, the current invitations and project members can be viewed in Member Invitations and Current Project Members respectively.
An email will be sent from "no-reply@osc.edu" - all folders should be checked, including spam/junk. If they did not receive this email, please contact OSC Help.
The invitation links are valid for 48 hours. If a link has expired, you will have to complete the form again. If the code has yet to expire, it will show in the show in the table and you can resend.
A complete sign up with result in username appearing in your Current Project Members table.
Removing users
Users can be removed by visiting the project details page and clicking Project Users -> Current Project Members and clicking the blue button left of the username in the list. Select Remove. Many users can be removed more easily by activating the red Enable Quick Removal/Approval button while in the Current Project Members section. There will then be a new column with a  symbol. Click the icon to delete the user instantly.
Invitations can also be deleted by navigating to Member Invitations and selecting the icon on the left of the invite.
Manage user roles
Users can be assigned an admin role on a project by the PI and other project admins. A user can be assigned this role by navigating to the project details page and clicking Project Users -> Administrative Roles -> Add User Role. The only two roles that should be used are Project, Admin Access and Project, No Admin Notifications. Both roles allow a normal user to manage the project as if they were the PI. This allows them to renew the project and manage all users on it.
Limiting charges with budgets
OSC offers the use of budgets to limit the amount of charges incurred on projects.
Active budget
Once a budget has been approved, it (and the project it was requested from) becomes active. Having an active project allows users on that project to submit batch jobs to use OSC resources.
Using a budget
As usage is accrued on a project, the remaining budget value seen on the project details page will decrease. Once the value of the remaining budget is zero or less, then the project will be restricted and that project can longer be used to submit batch jobs for OSC resources.
Project storage also reduces the remaining budget daily. Project storage is any amount of storage requested by the PI or project admin and is located in either /fs/project or /fs/ess directories.
Budgets are a Soft limit
A budget is not going to limit incurred charges to exactly the amount set. Depending on the situation, it could be over by a certain amount. If there are questions/concerns with a budget not correctly limiting charges at OSC, please contact OSC Help.
Once per day operations
The remaing budget amount is not a real-time representation. Completed jobs are uploaded to the client portal once per day. If one looked at their remaining budget and saw $5 was left, but a job that was completed and not yet uploaded to client used $4 worth of resources, then the actual remaining budget should be $1. The same goes for jobs which are still running, except it is unknown how much a running job will reduce the remaining budget by.
Shortly after job records are uploaded to client portal, this adjusts each projects remaining balance based on usage. At this time, if a remaining budget was zero or less, then the project will become restricted and no more jobs can be submitted using that project code.
Storage charges
The charges incurred by project storage are not affected by a project becoming restricted.
Manage profile information
Edit profile
Profile information can be changed by logging in with valid OSC credentials at MyOSC, navigating to the profile page by clicking the display name in the upper right corner of the page, and selecting Edit my profile.
The page will display information saved for that profile. Some of this information can be freely edited or changed, but other information can only be updated by an OSC admin, such as the institution. Please contact OSC help if there is incorrect information which is not editable.
Email address change
When trying to update an email address, you will need to wait to receive an email and verify the email address change before it will take effect. The email will be sent from "no-reply@osc.edu." All folders should be checked, including spam/junk. If you did not receive this email, please contact OSC Help.
PI status
If you already have an OSC account and want to request PI status to create your own project at OSC, visit the contact profile page.
Look for the Special Access Request section, select the checkbox for "I am an eligible PI" and upload a recent CV document. This will submit a request to OSC staff to review your profile and provide the PI status to your account.
Publications and Funding
There are two buttons for Publications and Funding. The Publications button will bring up a page on which you can manage bibliographic information about publications to reference in account requests or renewals. The Funding button will bring up a page on which you can record funding from other sources to also reference in account requests or renewals.
Information review
Contact information should be verified yearly.
Once a year, after logging into the client portal, you will be redirected to a contact verification page where any out-of-date or incorrect profile information should be updated accordingly.
Multi-factor authentication
MyOSC now supports multi-factor authentication (MFA).
User opt-in
Users can now opt-in to using multi-factor authentication in MyOSC.
On a user's profile page, there will be a button Enable DUO MFA.

There will be an error displayed with the text:
One must log out of MyOSC, then log back in to continue the DUO Device Management process where device information can be entered and saved. See this page on accepted DUO authentication methods.
Removing MFA
If an OSC account is not required to use MFA, then it can be disabled at any time.
Navigate to your profile page in MyOSC, then select DUO Settings and click the Disable DUO MFA button.
Please note, accessing OnDemand after removing MFA may display an error message that DUO has been disabled. If this happens, please contact OSC Help for assistance.
Project requires MFA
There is also a flag that can be set on a per-project basis, which will require all users on that project to use MFA.
Contact us at OSC Help if you would this enabled on a project.
Project review and special properties
Projects at OSC should be reviewed, at least annually, and OSC staff should be kept up to date on any data with special restrictions being stored at OSC.
Project annual review
Projects at OSC are required to be reviewed annually. This check will be for making sure that only accounts which need to use the project are members of the project, and that all users with admin roles still need that role. Furthermore, it is for checking that the project has an appropriate special property for the data being stored.
You will be prompted upon log in at MyOSC to verify. This will occur 365 days after your last project verification.
If you'd like to verify early, you can do so from the Project Details > Project Users. Now you are on the Manage Project Users table and there is a button to "Verify Project Members and Admins."
Please contact OSC Help if a special property needs added/removed to a project.
Projects with special data
If a project is storing data that has special restrictions on whom can access that data, then OSC staff should be made aware of this.
The project may be categorized as a protected data project, or the special restrictions could be simpler and just require permissions to be kept reasonably secure (e.g. NIH genomic data policy).
In both cases, the project should be labeled with a special property to explicitly show that data with special restrictions are being stored.
Please contact OSC Help if a special property needs added/removed to a project.
Projects, budgets and charge accounts
Client Portal, MyOSC, documentation
"Ohio Academic Fee Model FAQ" section on our service costs webpage
OSC client portal allows users to manage their projects.
Creating a new project
Any user with the Primary Investigator (PI) role can request a new project in the client portal. Using the navigation bar, select Project, Create a new project. Fill in the required information. See more details on these options below.
Once the project is created, you need to add authorized users, including yourself, to access the project, i.e. HPC resources.
Project types
Depending on the project type selected here, it will alter how budgets are approved.
The project types academic, commercial, and government/non-profit projects will use the approval process set up by the institution of the PI requesting the project. This could involve waiting on a fiscal approver to review the request, or having the request automatically approved.
The classroom project type will be routed to OSC staff for approval since all usage under a classroom project is fully discounted so that no charges are incurred by the PI. Remember that a syllabus is required for classroom projects to be approved.
Charge accounts
A PI can choose to create a new charge account or select an existing one when creating a new project. The PI will not be able to select anyone else as the owner. If a different owner is needed, please contact OSC Help. Note, the owner of the charge account can request changes to the project(s) under the charge account, including closure.
See "Charge accounts overview" section near the bottom of this page for more information on creating a new charge account.
Use the drop-down box to select an existing charge account. If there is a credit already added to an existing charge account, then the text '(credit: <dollar-amount>)' will show next to the charge account name.
For PI associated with Ohio academic institutions, the annual Ohio academic credit of $1,000 will be added automatically to the charge account selected here, if the credit has not already been added. The credit will be added after the first budget of the fiscal year is approved.
The charge account is important because it is used for credits (such as the annual credit available to Ohio Academics). Many projects can be grouped under a single charge account, which also means many projects can take advantage of that charge account's credits as well.
The $1,000 annual billing credit for Ohio academic PIs is allocated once on a fiscal year basis.
Special properties
Special properties can currently only be added by OSC staff.
If the project will contain sensitive data such as PHI (HIPAA related), ITAR, etc, then contact OSC to use the protected data service which provides controls to keep data secure.
Misc fields
- Project title
- Field of science
Creating a budget
After entering the required information on the project creation page, a budget can be created.
For projects that are already created, head to the project details page and click the Create new budget button, and go through the budget creation process again.
Budgets are used to constrain spending in a fiscal year, but bills are based on service type and utilization. Budgets can be replaced at any time.
Timeframe
First, select the timeframe that the budget should be created for.
The timeframe can either be for this fiscal year or the next fiscal year.
A fiscal year is from July 1st to June 30th the next calendar year.
Budget type
There are two types of available budgets, limited and unlimited.
Limited budgets are used for projects that want to put a maximum on the charges that can be incurred. This is useful for a PI that creates a new project, receives the $1,000 annual credit, then sets a limited budget of $1,000.
Unlimited budgets are for projects that will not have a spending limit.
To create a limited budget, answer yes to 'Do you want to set a dollar budget?'. For an unlimited budget, select no.
If you have a restricted project you want to re-use, you would submit the budget request under that project code.
Org Fiscal Reference text field and checkbox
There are two fields that may need to be filled in.
The Org Fiscal Reference is an internal accounting field for the project's organization.
For e.g. At The Ohio State University, a PI should enter the cost center information here. At Case Western Reserve University, a PI should enter the speedtype information here.
The Fiscal Approval checkbox is an option displayed for a PI that can automatically activate a budget without requiring review. It has the PI declare that they have already been approved for spending at OSC.
Submit budget review or activating budget
After filling in budget information, the next page will be different depending on whether the PI's institution has set up a review process at OSC.
If the institution allows PIs to activate their own budget, the PI simply clicks Activate Budget, then the project and budget are both set to active.
If the institution requires a review of the budget, an email will be sent to reviewers. Once the reviewers decide on approving, partially approving (an amount different than the PI's request), or rejecting, the PI will receive a notification of the response.
Storage request
Storage can be requested from the project details page. Look for the button request storage change.
The difference between different storage at OSC is described in available file systems.
Please contact oschelp@osc.edu to request that project storage be removed and no longer charged for.
Managing projects
Projects that have been created should be managed periodically.
View all projects
To view all projects, even those not submitted for approval and still waiting on approval, navigate to Project, Project List.
View Budgets
Go to the project details page and select the Budgets button to view current and past budgets.
Charge accounts overview
Create a new charge account
PI's can create a charge account, which allows them to group projects together under that charge account.
To create a new charge account, select from navigation bar Charge account, then Create new charge account or select Project, then create new project and leave charge account selection at Generate a new charge account.
See information on the fields below.
Parent charge account
Every charge account created by a PI must have a parent. Either enter the name of the parent if it is known, or clear the parent charge account selection, then click the button View hierarchy, then Collapse all, to show the available parent charge account options.
With the hierarchy view shown, look for the correct parent charge account. For most academic PI's, there may be a "<institution> top-level" charge account that can be selected. There may also be colleges and department charge accounts under the colleges. Select the correct charge account based on your current position.
Contact
Leave the contact as your own user account.
Display name
The title of the charge account being created. Can be useful to provide a summary name for the types of projects that will be created under the charge account.
Submit or save for later
Click the submit button to create the new charge account or save for later button to come back to the charge account later.
View credits
Credits can be viewed at Charge account, then Charge account list.
This will display all charge accounts created by you, and a column for "Total dollars given", which is the total credit available for that charge account.
Questions on what is a budget? What is the credit?
Please see service terms for further explanations or contact oschelp@osc.edu
billing statements
MyOSC now offers the ability for PIs to view the billing statements of current un-billed usage for their projects.
Login to my.osc.edu and navigate to Project -> Billing Statements.
There are two sections:
Current usage
The current usage section provides information usage charges up to the current day.
These are not final charges, as they may be countered by credits or discounts at the time billing is ran.
Statements
The statement section lets PIs view past statements that will include information about charges including discounts and credits applied for that period.
HPC Job Activity tool
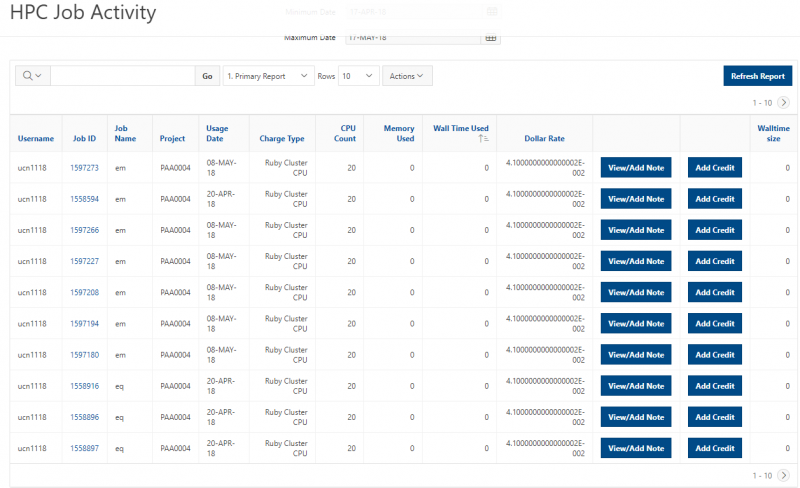
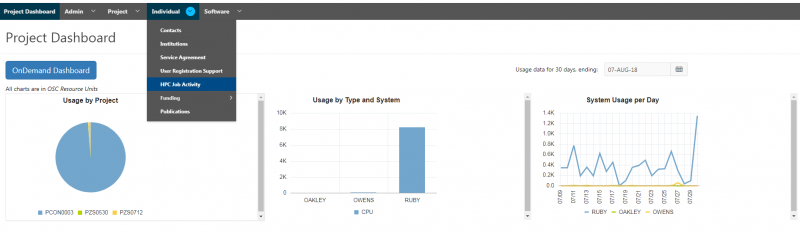
Interactive reporting of HPC job activity
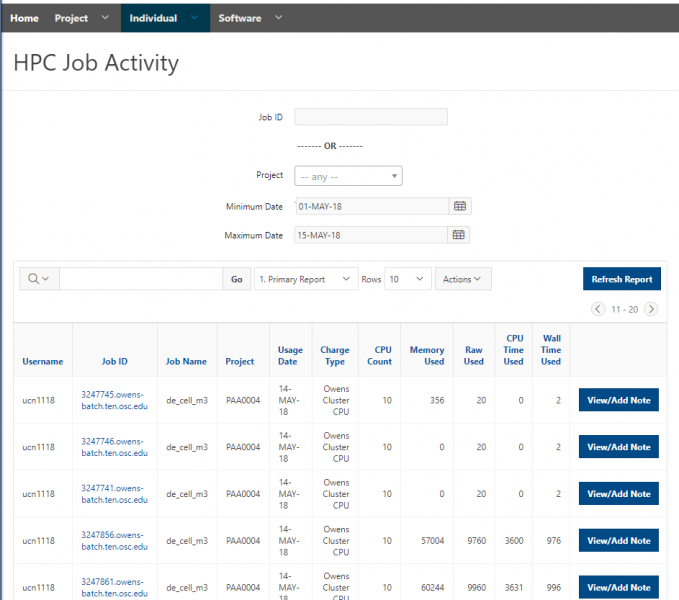
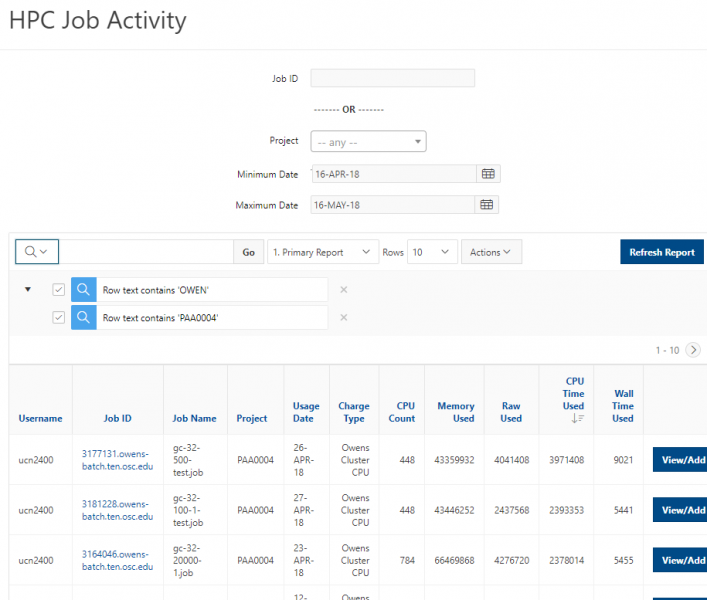
The HPC Job Activity menu item opens a powerful reporting tool. By default, the report shows all activity over the last 30 days for projects you are authorized to view usage of. There are simple filters available at the top to put in a specific job ID, narrow the report to a specific project, or select a specific date range.
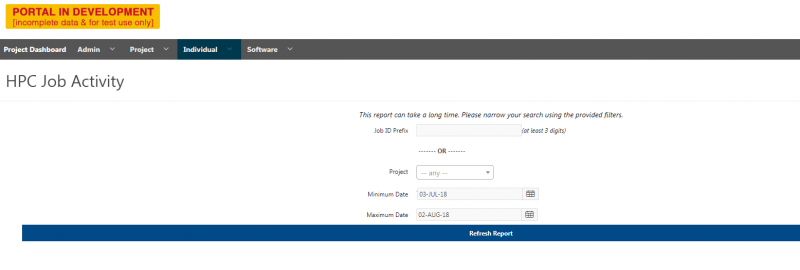
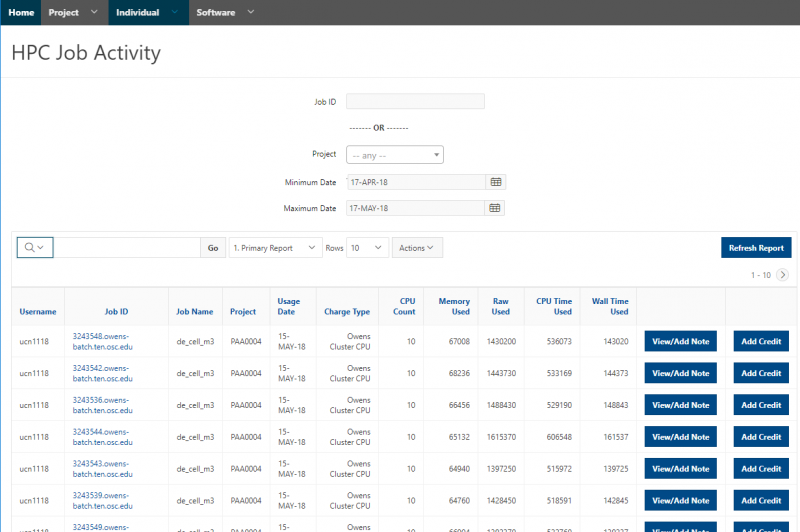
Click ‘Refresh Report’ to get the job activity report as shown below:

There are more details on how to do advanced reports discussed in ‘Interactive Reporting’ section, but here are some basics about interacting with the report. Clicking on a column header will bring up a quick filter menu where you can filter the records, sort by that column, hide the column, or group by each unique entry.
In addition, you can do a quick text search, select which saved report you wish to view (if you have any saved reports), change the number of rows per page, and do advanced actions from changing the visible columns to aggregating data, creating charts, and saving your custom report formats.
View job scripts
To view the script associated with a job, you can click on the ‘Job ID’ for that job. This will open a pop-up dialog with the first 5kb of the job script, with a button to enable you to download the entire script.

Importantly, you will notice that the script is not identical to what you submitted on the command line; this is because our infrastructure scripts will add some additional information of value to the scheduler and record that information in the final job script.
If a job is interactive, the job script will not be recorded because there isn’t one! We do not have a mechanism to record what happens in an interactive batch job and store that in the accounting system. You may want to use descriptive job names in your batch submissions if you want to be able to review utilization and determine what a job was for when no script is recorded.
Creating a job note
There is a column available in the report that provides a per-row button labeled “View/Add Note”. This button will open a dialog window that will allow you to view any notes that have been added to a job or create a note. At 200 characters, notes are fairly short, but they do allow you to add a little bit of metadata to a job once it is in the accounting system.
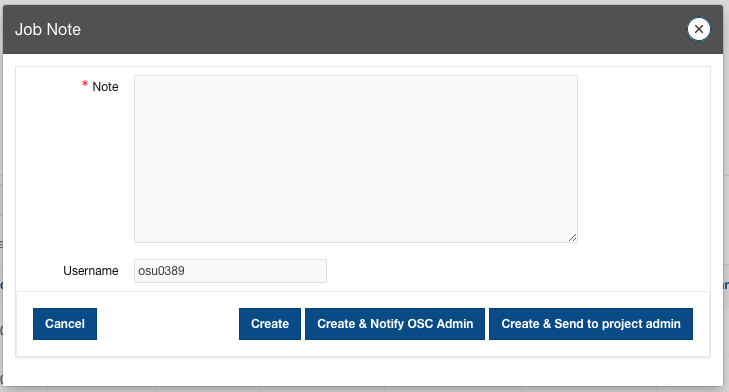
There are three “create” buttons available, which take slightly different actions. Clicking “Create” will just save the note in the job record. Clicking “Create & Notify OSC Admin” will allow you to save the note and notify OSC staff that there is a job note they should review. Please note, this is not the recommended or preferred method for reporting job problems. Please continue to email OSC Help. Finally, “Create & Send to project admin” will add the note to the job record and notify the PI and project admins that there is a job note that needs to be reviewed.
Interactive Reporting
In the client portal, interactive reporting is provided using Oracle Application Express (APEX) which allows end users to query data and customize reports. This interactive reporting allows users to:
- Customize the layout of the data by choosing the columns they are interested in, applying filters, highlighting, and sorting
- Define breaks, aggregations, different charts, and their own computations
- Create multiple variations of the report and save them as named reports, output to comma-delimited files, and print them to PDF documents
The discussions here are also applicable to other pages where data can be manipulated similarly.
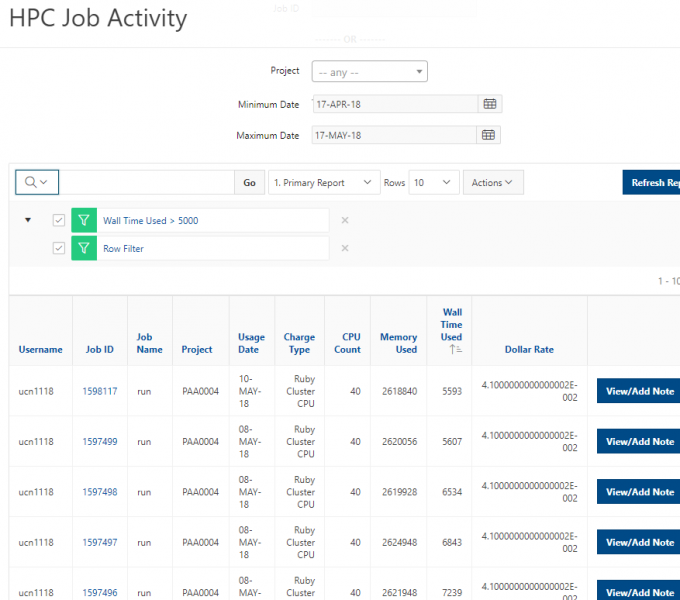
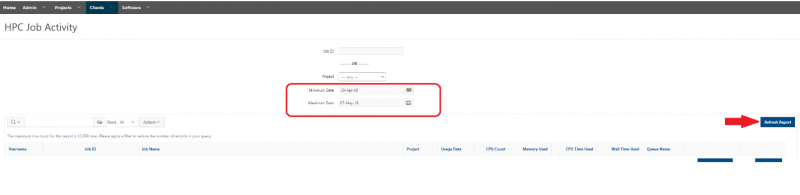
The HPC Job Activity page
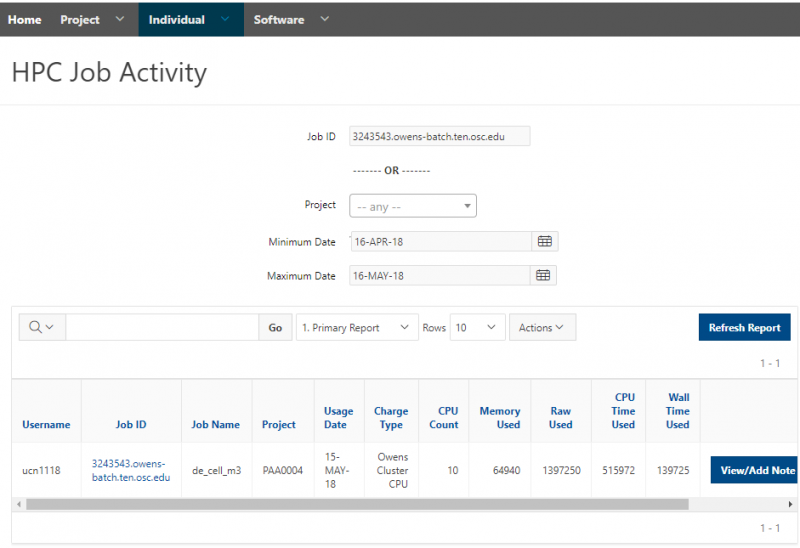
Navigate to Individual -> HPC Job Activity.
Click Refresh Report to get the job activity report as shown below. By default, the report shows a table of all activity over the last 30 days for projects you are authorized to view usage of, with 10 rows per page.
There are simple filters available at the top to put in a specific job ID, narrow the report to a specific project, or select a specific date range. Click “Refresh Report” to update the table with new filters.
For more advanced functions of using filter, see the discussion of ‘Filter’.
Column sorting and filtering
Many actions can be performed by clicking on a column heading. These include:
- Sorting data (both ascending and descending)
- Hiding the column
- Creating a control break
- Viewing of the column text and the ability to select a value to create a quick filter
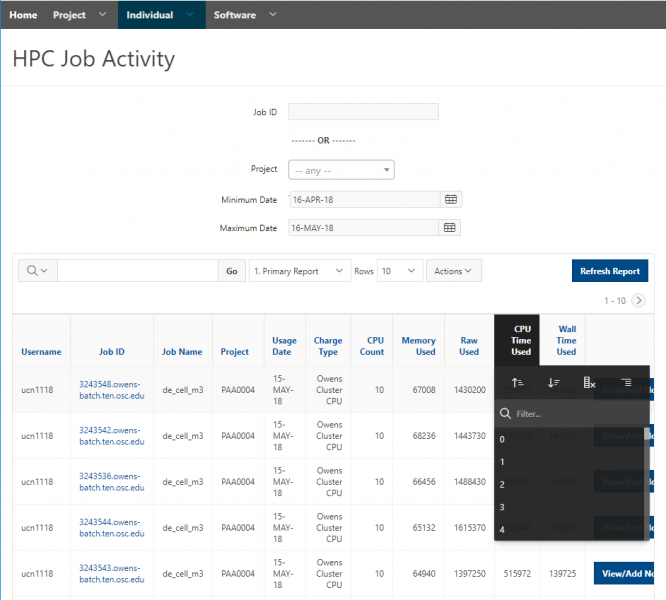
Let’s use the column ‘CPU Time Used’ as an example for detailed discussions. Click ‘CPU Time Used’:
- Click ‘
 ’, and the jobs will be listed based on the value of CPU time in ascending order
 - Click ‘
 ’, and the jobs will be listed based on the value of CPU time in descending order
 - Click ‘
 ’, and the column ‘CPU Time Used’ will be removed from the table
 - Click ‘
 ’, and the table will be split into multiple groups, where each group shares the same value of CPU time
It also lists all the available values of CPU time. You can select a value to create a quick filter, and the table will be updated to list the jobs of which the CPU time is the specified value:
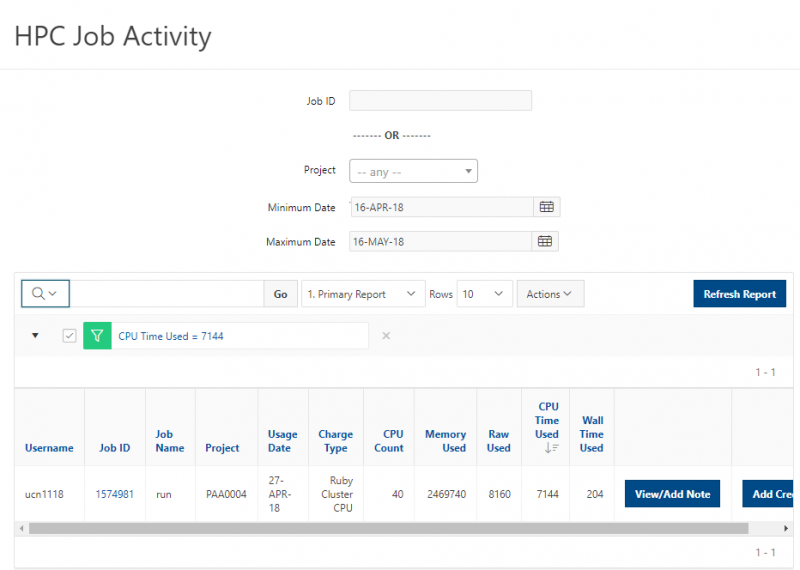
You can also use ‘search’ to narrow down the information to be viewed.
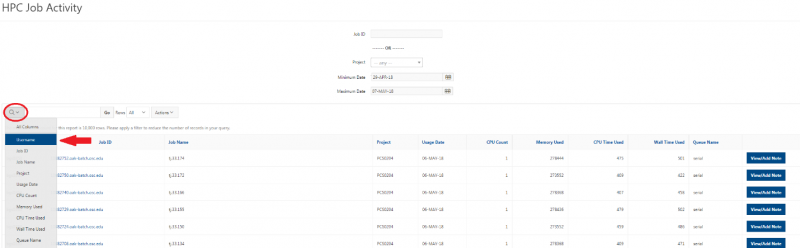
Adjust the displayed information in the table
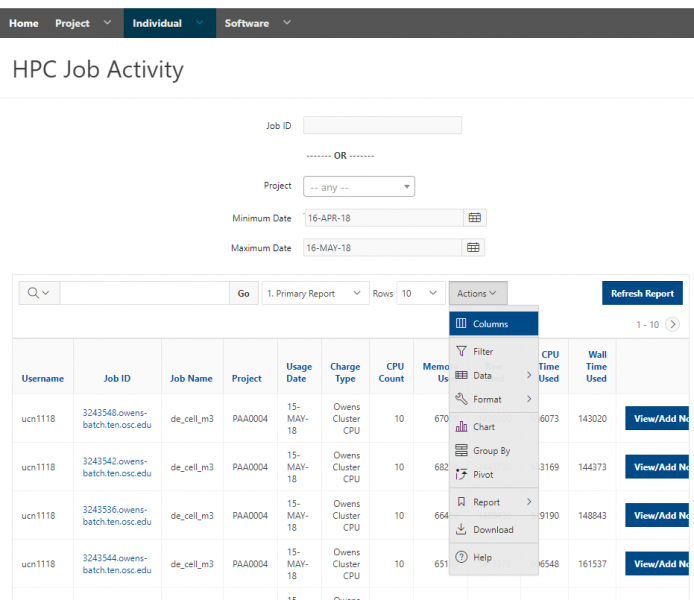
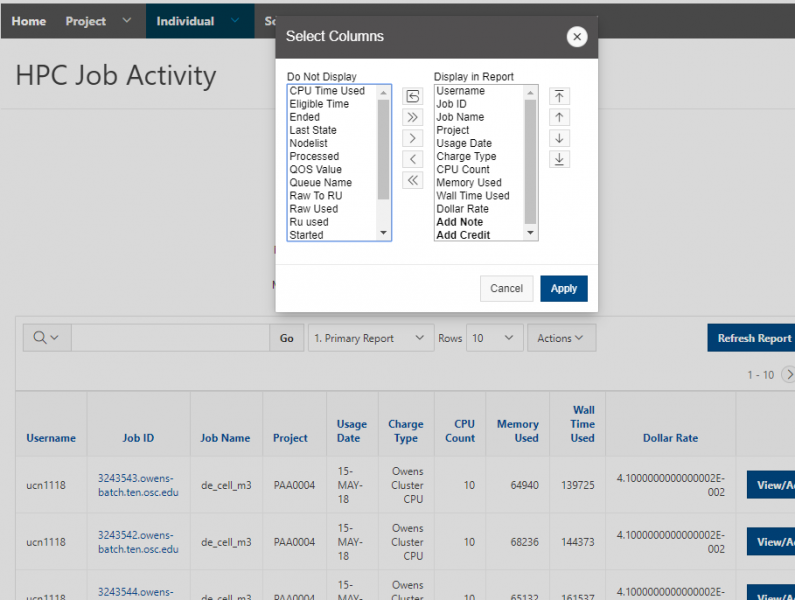
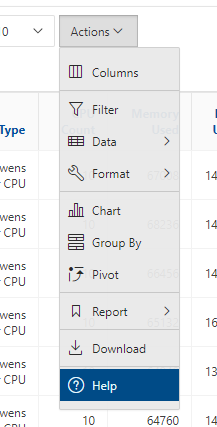
You can adjust the columns to be displayed in this table to see more/less information. Click ‘Columns’ within the ‘Actions' dropdown menu:
You will get the pop-up window shown below. The columns on the right are displayed. The columns on the left are hidden. Select the information to be displayed using ‘>’; select the information to be NOT displayed using ‘<’. You can also reorder the displayed columns using ‘↑’ and ‘↓’. Click ‘Apply’ button to apply the changes.
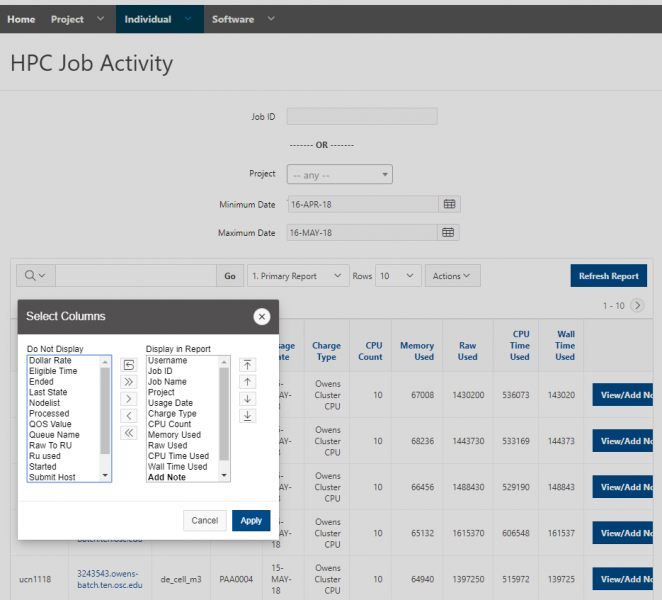
Most columns are self-explanatory. Computed columns are prefixed with **. Definitions of some columns are provided below:
- Project: which project this job is charged to
- Usage Date: the date when this job is charged
- Memory Used: in bytes
- CPU Time Used: in seconds
- Wall Time Used: in seconds
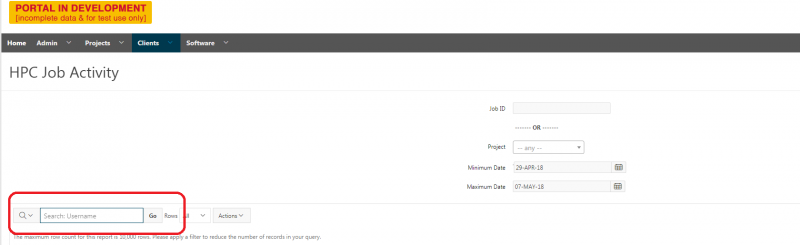
'Search' tool
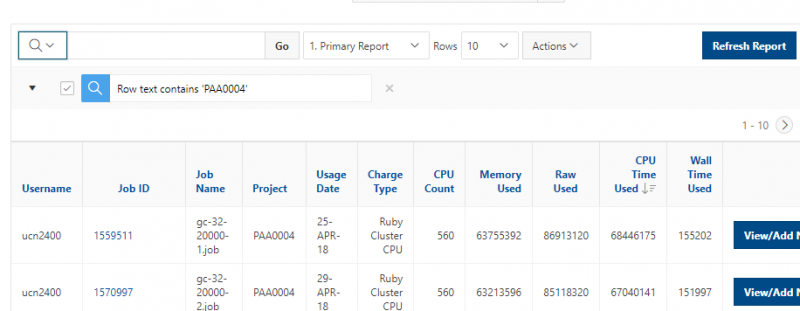
The ‘Search’ tool enables you to narrow down the displayed report that contains specific text only. To search all columns, simply type the text in the search box and click on ‘Go’ or press ‘Enter’.
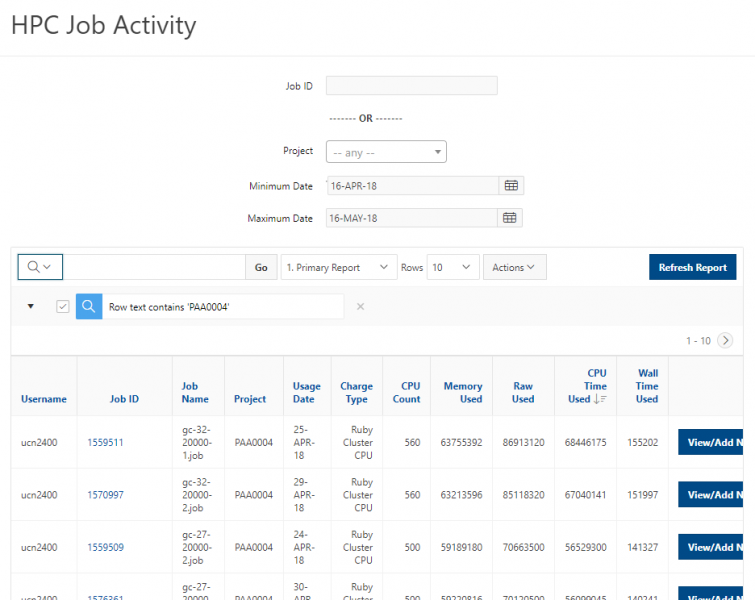
The page will be refreshed automatically to display the results following the search criterion, with the search criterion being listed above the table:
To apply multiple search criteria, add another search criterion after one search criterion is applied. Always remember to hit ‘Enter’ to apply the search criterion:
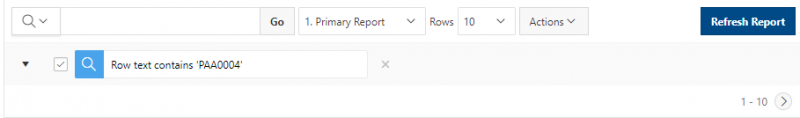
Check the box on the left to display/not display the results following this search criterion. The displayed results will be refreshed automatically:

Click the ‘x’ on the right to remove this search criterion. The displayed results will be refreshed automatically:
To search one specific column, select the column from the dropdown ‘˅’ to the left of the search box before providing the text in the box:
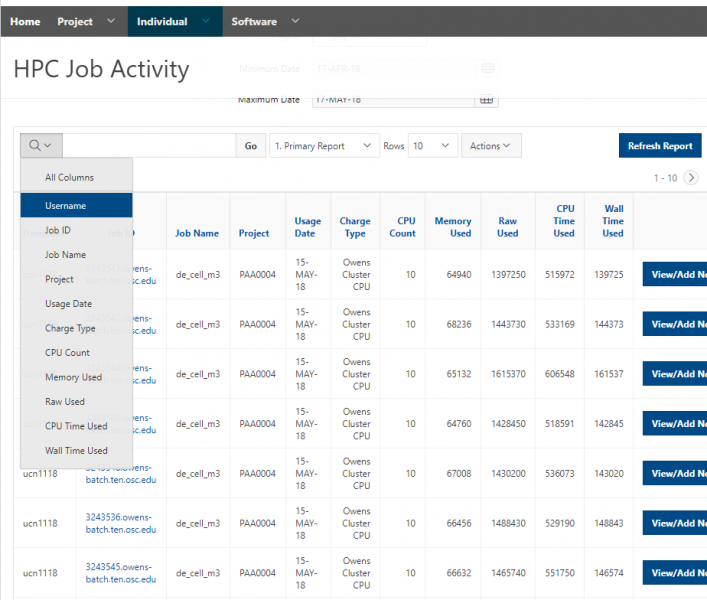
For instance, if you would like to get a report of HPC jobs submitted by user ‘ucn1118’ only, select ‘Username’ from ‘˅’. ‘Search: Username’ will be displayed in the ‘search’ box:

Type ‘ucn1118’ and hit ‘Enter’ in the box, jobs submitted by ‘ucn1118’ only will be displayed in the table, as shown below:

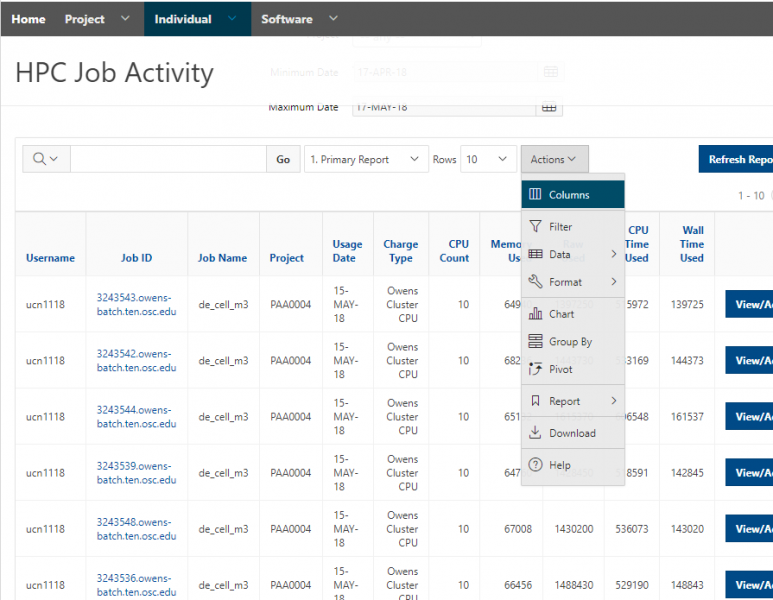
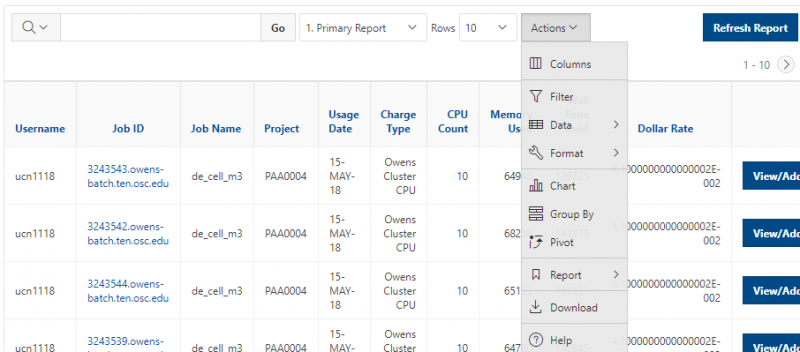
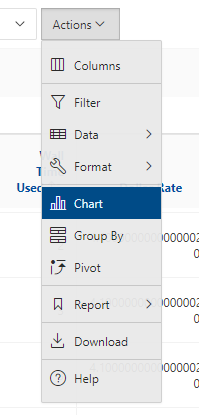
'Actions' menu
The ‘Actions’ menu contains many tasks that are useful in querying data and customizing reports. Click ‘˅’ to get a list of available functions.
For more information, see: [1] and [2]
Adjust the displayed information in the table
Click ‘Columns’ within the ‘Actions' dropdown menu, you can adjust the columns to be displayed in this table to see more/less information.
See here for more info: ‘Adjust the displayed information in the table’.
Query data and format report
Within the ‘Actions' dropdown menu, it provides the following tools to query data and format report:
- Filter
- Data
- Format
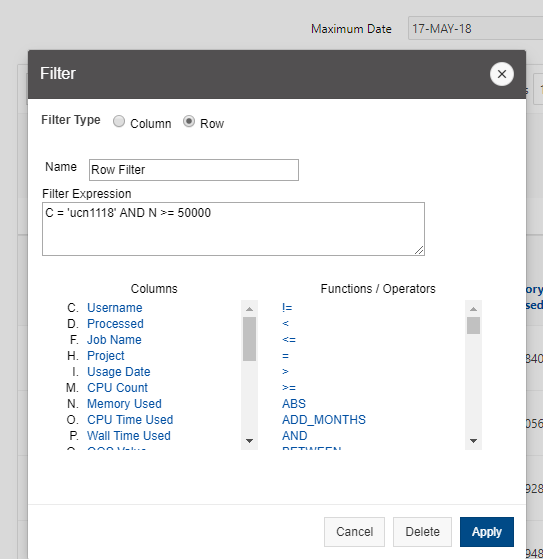
Filter
Click ‘Filter’ within the ‘Actions' dropdown menu as below:
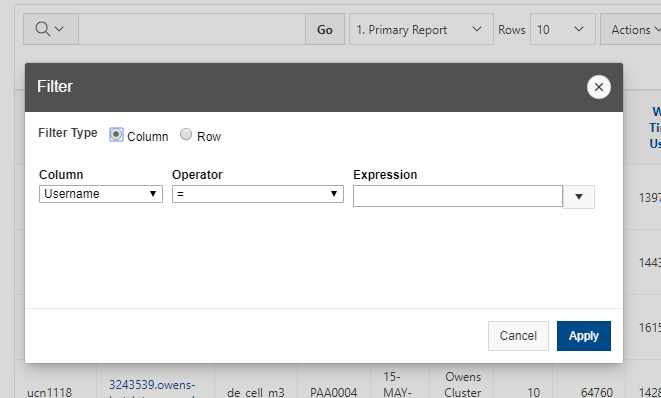
You can create the filter based on either ‘Column’ or ‘Row’.
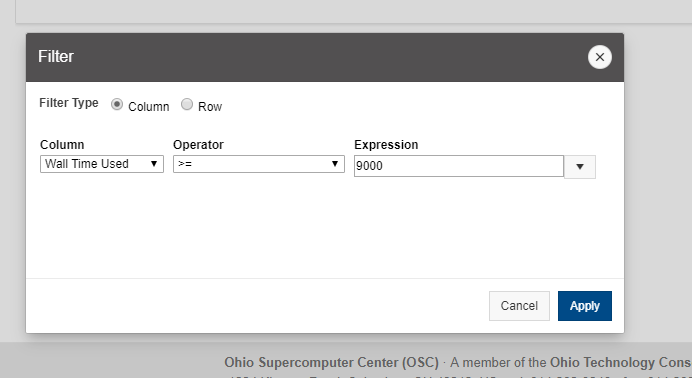
If you filter by column, select a column using ‘▼’, a standard Oracle operator using ‘▼’, and enter an expression to compare against. Expressions are case sensitive. Use % as a wild card, if needed. You can also select the expression using ‘▼’.
If you filter by ‘Row’, you can create complex WHERE clauses using column aliases and any Oracle functions or operators. Click ‘Apply’ to apply the filter:
Data
Click ‘Data’ within the ‘Actions' dropdown menu. You can sort data, perform mathematical computation on column, add computed column to your report, and perform a flashback query within ‘Data’ menu.

- Sort
It is used to change the columns to sort on and determines whether to sort in ascending or descending order. You can also specify how to handle NULLs. The resulting sorting displays to the right of column headings in the report.

- Aggregate
Aggregates are mathematical computations performed against one column. Click ‘Aggregate’ to get the pop-up window shown below:
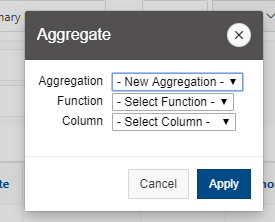
Here, ‘Aggregation’ enables you to select a previously defined aggregation to edit; ‘Function’ is the function to be performed (for example, SUM, MIN); ‘Column’ is used to select the column to apply the mathematical function to. Only numeric columns display.
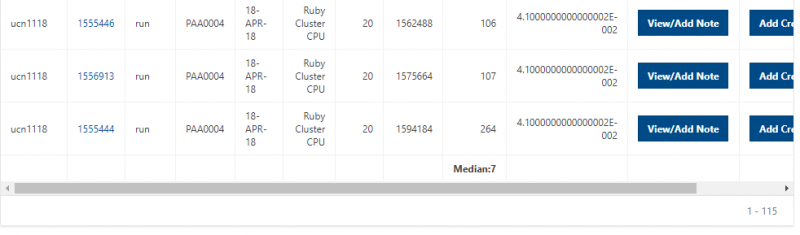
Click the ‘Apply’ button, the aggregates will be displayed at the end of the report within the column they are defined.
- Compute
It enables you to add computed columns to your report. These can be mathematical computations or standard Oracle functions applied to existing columns. Click ‘Compute’ to get the pop-up window shown below:
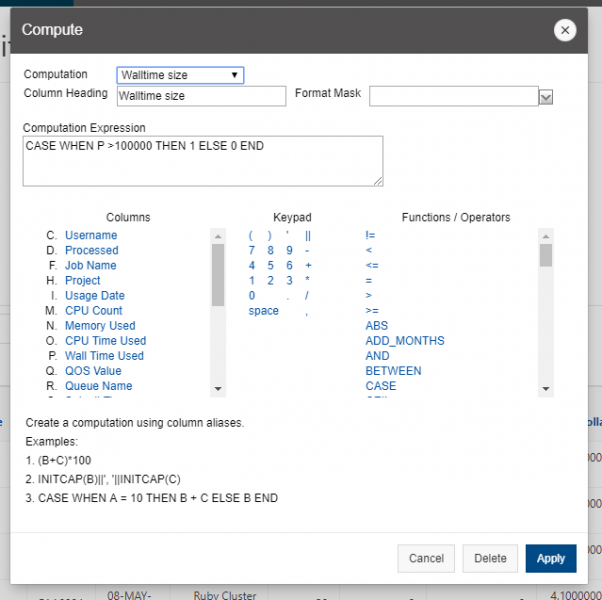
Here, ‘Computation’ enables you to select a previously defined computation to edit; ‘Column Heading’ is the name of this new column displayed in the table; ‘Format Mask’ is an Oracle format mask to be applied against the column; ‘Computation Expression’ is the computation to be performed where columns are referenced using their associated alias. Clicking on the column name or alias includes them in the Computation. Next to Columns is a keypad. This keypad functions as a shortcut to commonly used keys and inserts those keys in the Computation. On the far right are Functions.
Once the computation is defined, click ‘Apply’ button. The computed column will be displayed as the last column of the table.
- Flashback
A flashback query enables you to view the data as it existed at a previous point in time. The maximum amount of time that you can flashback is 7047 minutes.

Format
Click ‘Format’ within the ‘Actions' dropdown menu:

Using ‘Format’ menu, you can split the report into multiple groups, highlight the rows that meet the filter, and modify the number of rows listed per page.
- Control Break
It is used to create a break group on one or several columns. Click ‘Control Break’ to get the pop-up window shown below:
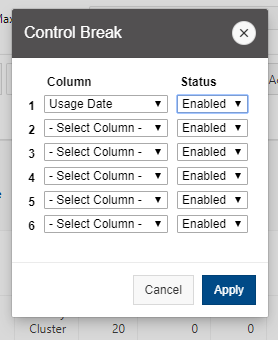
Enable or disable the column for control break. Click ‘Apply’ button. This pulls the columns out of the Interactive Report and displays them as a master record.
- Highlight
It allows you to define a filter. The rows that meet the filter are highlighted using the characteristics associated with the filter. You can highlight the entire row or just the affected cell and can select a new color both for the background and the text. Click ‘Highlight’ to get the pop-up window as below:
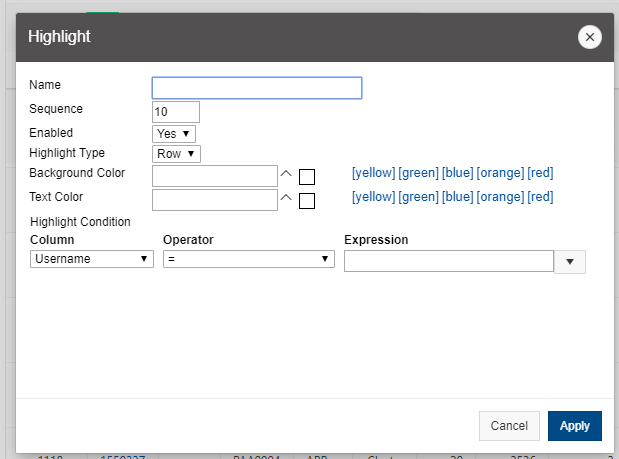
Here, the options include:
- Name: provide a name for this ‘highlight’. Once it is defined, it will be displayed on the top of the table with returned results
- Sequence: identifies the sequence in which the rules are evaluated.
- Enabled: identifies if a rule is enabled or disabled.
- Highlight Type: identifies whether the row or cell should be highlighted. If Cell is selected, the column referenced in the Highlight Condition is highlighted.
- Background Color: is the new color for the background of the highlighted area.
- Text Color: is the new color for the text in the highlighted area.
- Highlight Condition defines the filter condition.
Click the ‘Apply’ button. This pulls the columns out of the Interactive Report and displays the results with defined highlights.
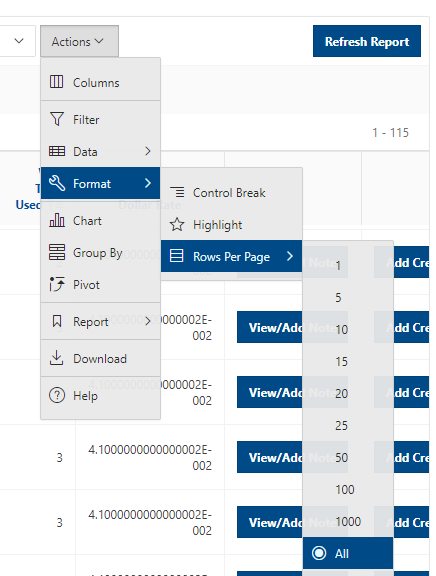
- Rows Per Page
You can select the value to modify the number of rows listed per page.
Data visualization
Different tools are available in client portal for the data visualization, including:
- Chart
- Group By
- Pivot
Chart
Click ‘Chart’ to get the pop-up window as below:
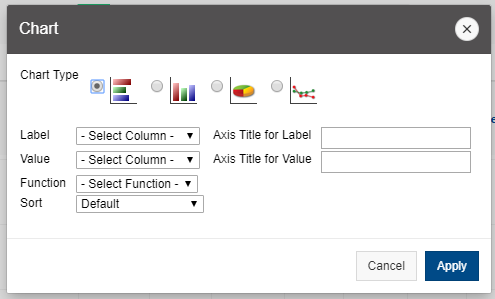
Here, the options include:
- Chart Type: identifies the chart type to include. Select from horizontal bar, vertical bar, pie, or line.
- Label: enables you to select the column to be used as the label.
- Axis Title for Label: is the title that displays on the axis associated with the column selected for Label. This is not available for pie chart.
- Value: enables you to select the column to be used as the value. If your function is a COUNT, a Value does not need to be selected.
- Axis Title for Value: is the title that displays on the axis associated with the column selected for Value. This is not available for pie chart.
- Function: is an optional function to be performed on the column selected for Value.
- Sort: allows you to sort your result set.
Click the ‘Apply’ button. You will get the page in which the chart is generated. You can include one chart per Interactive Report. Once defined, you can switch between the chart and report views using the icons beside ‘Go’:
Group By
Click ‘Group By’ to get the pop-up window as below:
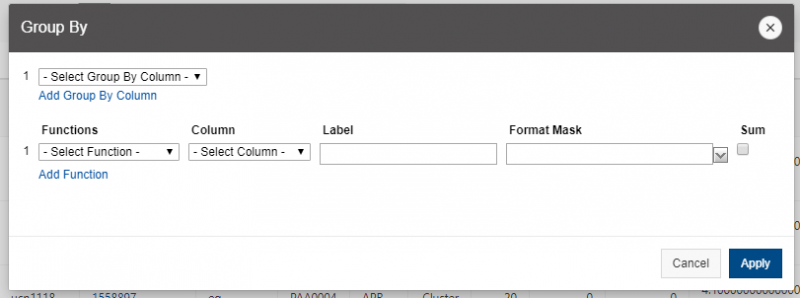
Here, the options include:
- Add Group By Column: the columns on which to group
- Add Function: the columns to aggregate along with the function to be performed
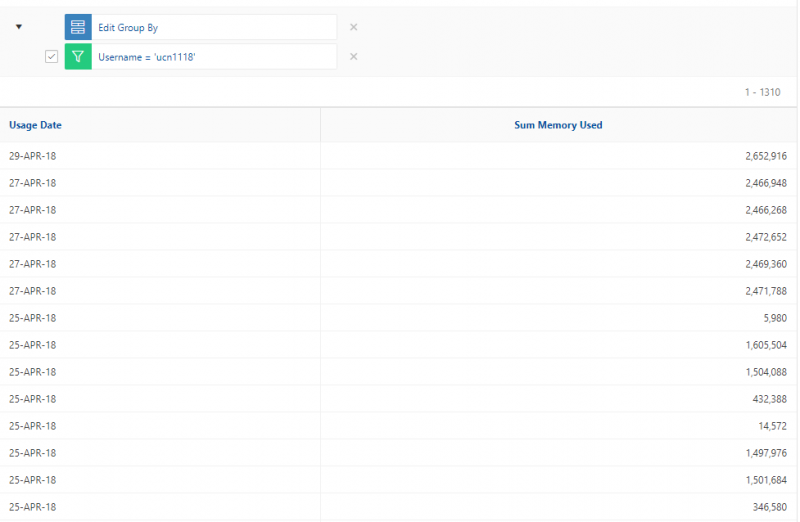
Click the ‘Apply’ button. You will get the page in which the Group By view is generated. You can include one Group By view per Interactive Report. Once defined, you can switch between the Group By and report views using the icons beside ‘Go’:
Pivot
Click ‘Pivot’ to get the pop-up window as below:
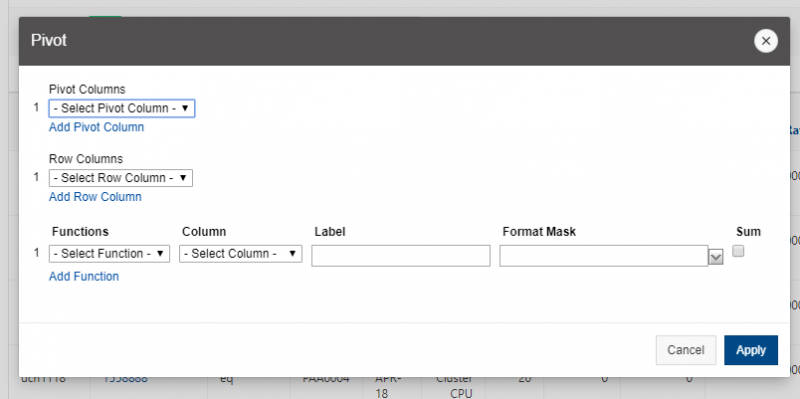
Here, the options include:
- Add Pivot Column: the columns on which to pivot
- Add Row Column: the columns to display as rows
- Add Function: the columns to aggregate along with the function to be performed
Click the ‘Apply’ button. You will get the page in which the Pivot view is generated. Please note that Pivot does not work for very large datasets e.g. ~5000 entries. You can include one Pivot view per Interactive Report. Once defined, you can switch between the Pivot and report views using the icons beside ‘Go’:
Save/Reset report
Within ‘Report’ menu, you can save the customized report for future use, or remove any customizations that you have made and reset the report to the default settings.
Save Report
‘Save Report’ saves the customized report for future use (it will be there after logging out and back in again). Click Save Report’ to get the pop-up window shown below:

You provide a name and an optional description. For now, all customized reports are private, which means only the end user that created the report can view, save, rename or delete the report. If you save customized reports, a Reports selector displays in the Search bar:

You will be able to choose the reports between ‘Default -> Primary Report’ (which is the report that initially displays) and ‘Private -> Your defined reports’
Reset
‘Reset’ brings the report back to the settings when logged in, removing any customizations that you have made. Click ‘Reset’ to get the pop-up window as below:
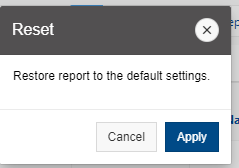
Click the ‘Apply’ to confirm. You can also uncheck the checkbox next to any customization to temporarily disable it or click the ‘x’ icon to remove the customization.
Download
‘Download’ enables the current result set to be downloaded. Click ‘Download’ to get the pop-up window:

The download formats differ depending upon your installation and report definition but may include CSV, HTML, PDF, or Email. Click the icon of the format you wish to download in.
Help
‘Help’ provides you more detailed user guide on ‘Action’ menu.
Example: create a chart report of daily HPC jobs by a user
In this example, I’d like to provide step-by-step instructions for creating a chart report of HPC jobs, in which:
- All jobs submitted by user ‘xwang’
- The data range is from April 29, 2018 to May 7, 2018
- The report shows the total CPU time per day
The following functions will be demonstrated:
- Use simple filter on ‘HPC Job Activity’ page
- Use ‘search’ tool
- Adjust rows to be displayed per page
- Adjust columns to be displayed in the table
- Format the data using ‘Control Break’
- Generate a chart report
- Save report
- Download report
- Click ‘Individual -> HPC Job Activity’
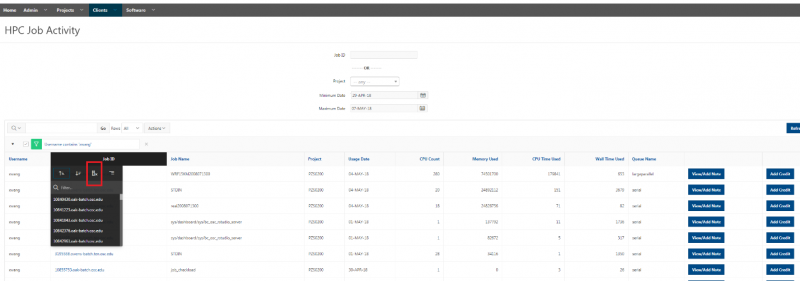
- You will get the ‘HPC Job Activity’ page. Change ‘Minimum Date’ and ‘Maximum Date’ to ‘29-Apr-18’ and ’07-May-18’, respectively. Click “Refresh Report’ to updated the information displayed in the table
- To listed the jobs submitted by user ‘xwang’ only, click ‘Search’ box and choose ‘Username’:
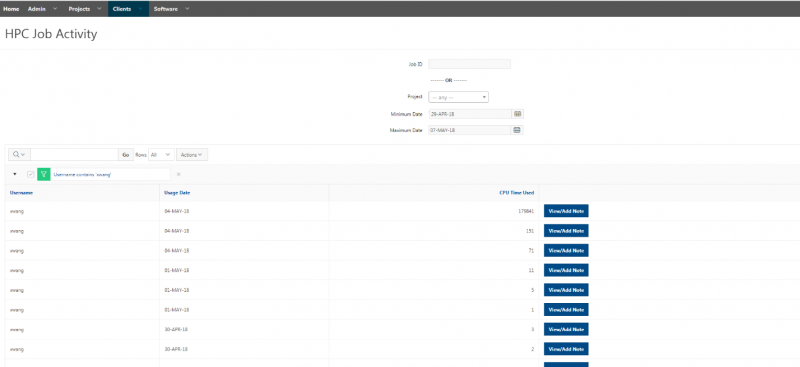
- Type ‘xwang’ in the ‘search’ box and press ‘Enter’.
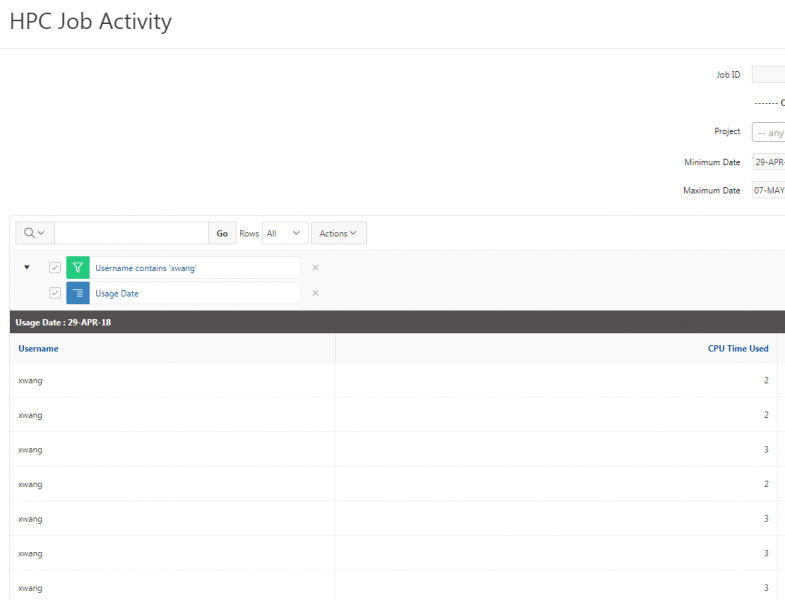
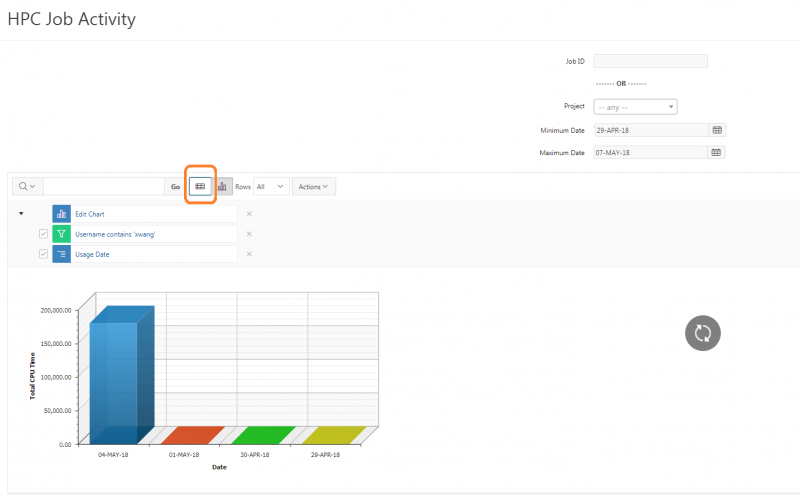
- You will get the table that lists all jobs submitted by user ‘xwang’ between April 29, 2018 and May 7, 2018, with the filter listed above the table. Change the number of rows displayed per page to ‘All’ to list all jobs, as shown below:

- Since we are interested in the daily CPU usage by ‘xwang’, we can remove some columns of the table by clicking the heading of some columns to hide the column. For instance, click ‘Hide Column’ icon in ‘Job ID’, the page will be refreshed automatically. The column ‘Job ID’ will NOT be displayed after refreshing:
- Perform similar operations on other columns. You can also adjust the columns to be displayed by clicking ‘Columns’ within the ‘Actions' dropdown and make ‘Username’, ‘Usage Date’, and ‘CPU Time Used’ to be displayed in the report. The final table is as below:
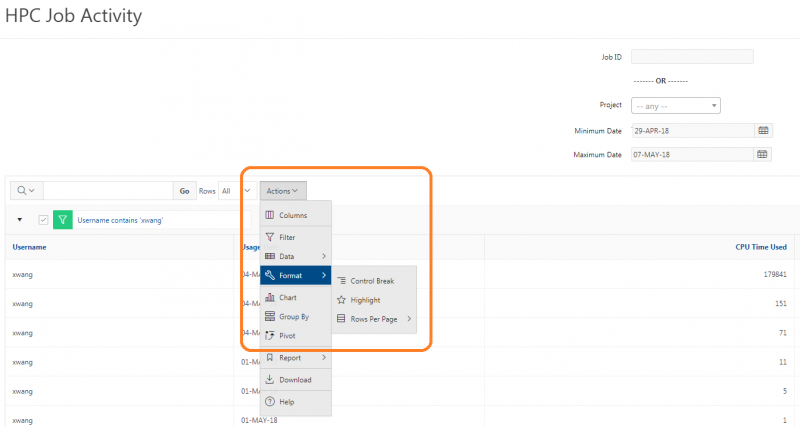
- To create a break group based on ‘Usage Date’, click ‘Actions -> Format -> Control Break’ as shown below:
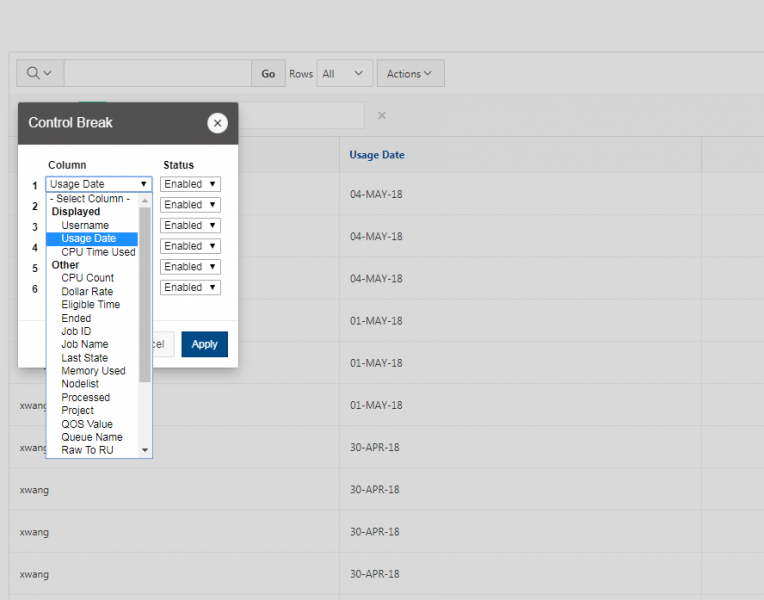
- You will get the ‘Control Break’ pop-up window. Choose ‘Usage Date’ under ‘Column’ with Status ‘Enabled’, as shown below:
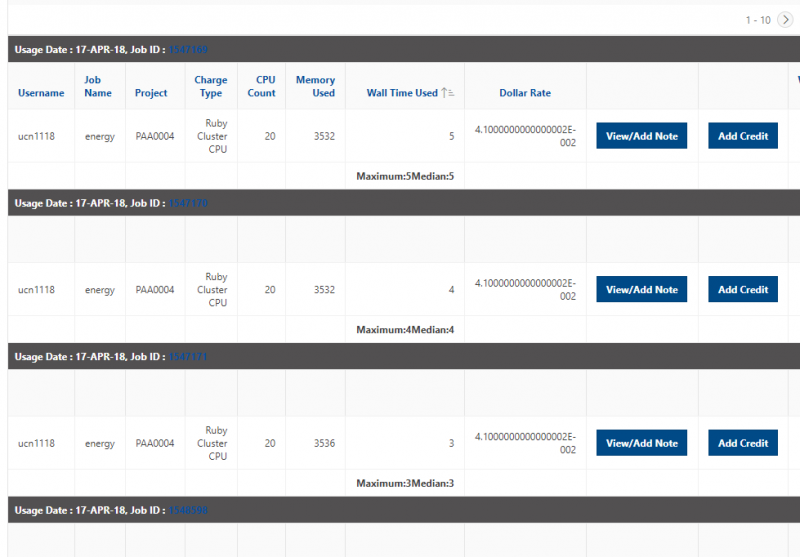
- Click ‘Apply’. This pulls the column ‘Usage Date’ out of the report and the jobs submitted by ‘xwang’ are grouped based on ‘Usage Date’, as shown below:
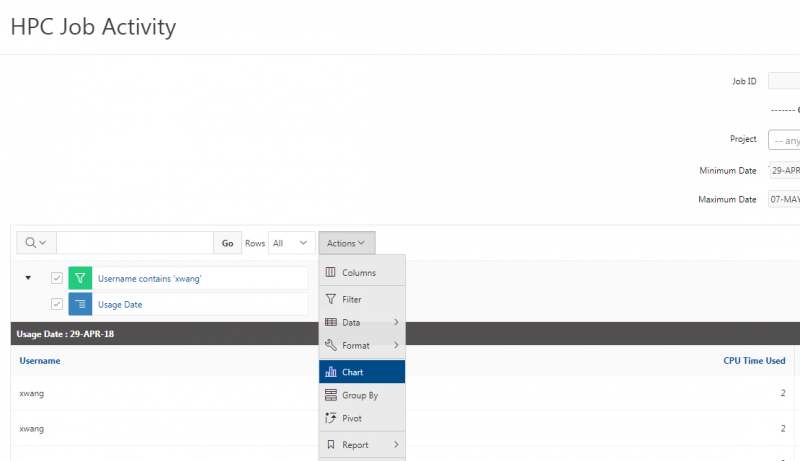
- To generate a chart report that shows the total CPU time per day, click ‘Actions -> Chart’ as shown below:
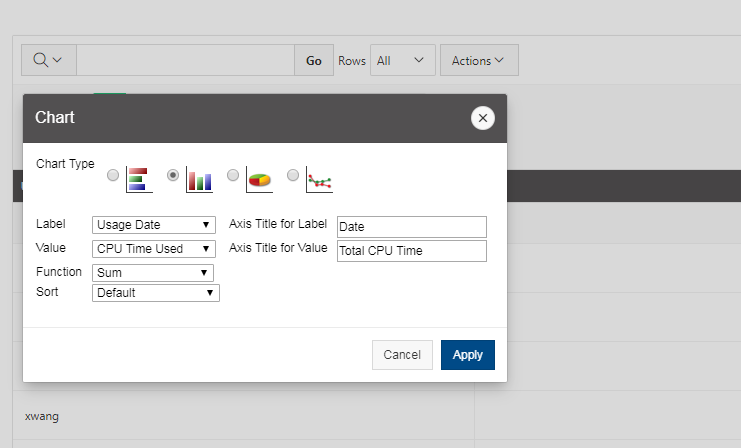
- You will get the ‘Chart’ pop-up window. Using the following information on the chart options, as shown in the image below:
- Chart Type: vertical bar
- Label: Usage Date
- Axis Title for Label: Date
- Value: CPU Time Used
- Axis Title for Value: Total CPU Time
- Function: Sum
- Sort: Default
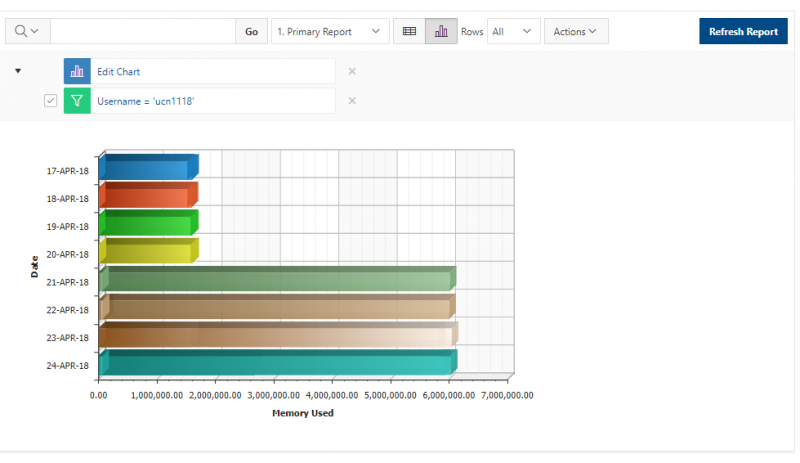
- Click the ‘Apply’ button. You will get the chart report showing the daily total CPU usage by ‘xwang’ between April 29, 2018 and May 7, 2018 (here, the CPU usage is zero if the date is missing in this chart):
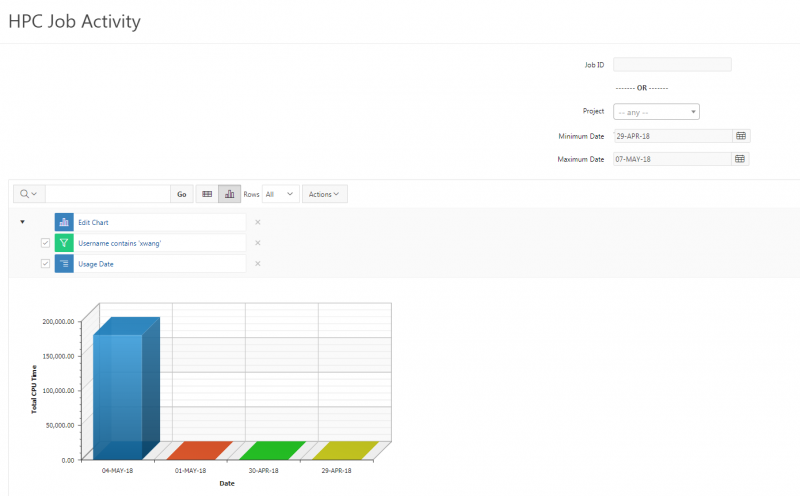
- From this chart, it is easy to see that ‘xwang’ used many CPU hours on May 4th, and very few CPU hours on other days. To switch back to report view, you can click the icon ‘View Report’ to the left of the row selection:
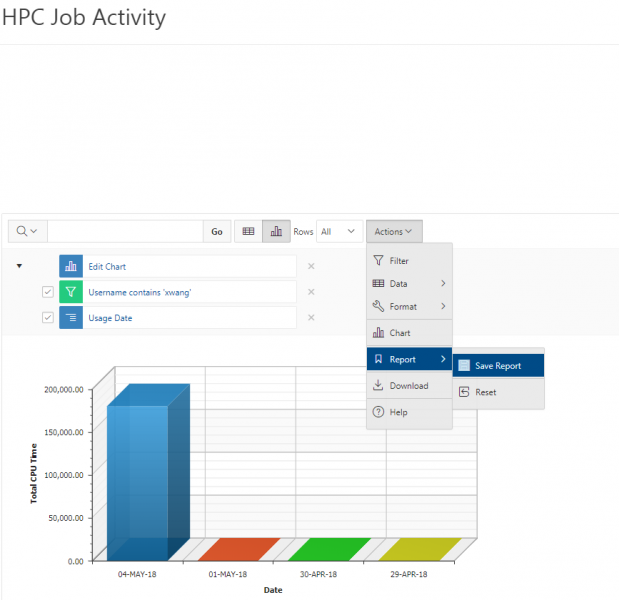
- You can save this report for future use by clicking ‘Actions -> Report -> Save Report’ as shown below:
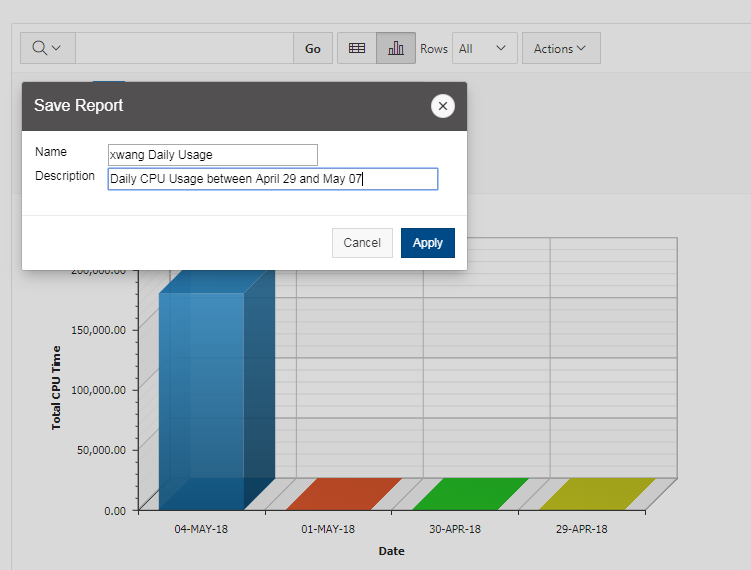
- You will get the ‘Save Report’ pop-up window. Provide ‘xwang Daily Usage’ as the name and ‘Daily CPU Usage between April 29 and May 07’ as Description, as below:
- Click ‘Apply’ button to save the report. Now, beside ‘Go’, you will be able to choose the reports between ‘Default -> Primary Report’ (which is the report that initially displays) and ‘Private -> xwang Daily Usage’, as shown below:
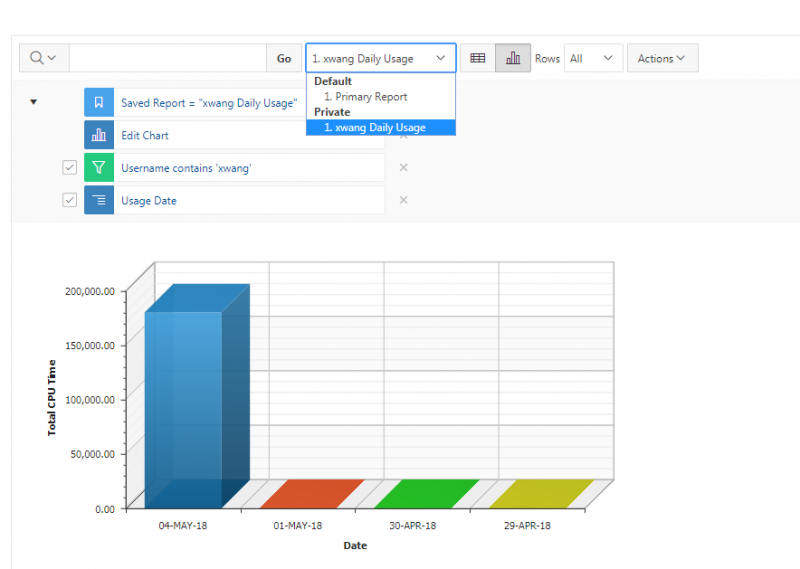
- For now, all customized reports are private, which means only the end user that created the report can view, save, rename or delete the report.
- You can download this report by clicking ‘Actions -> Download’ as shown below:

- You will get the ‘Download’ pop-up window as below:
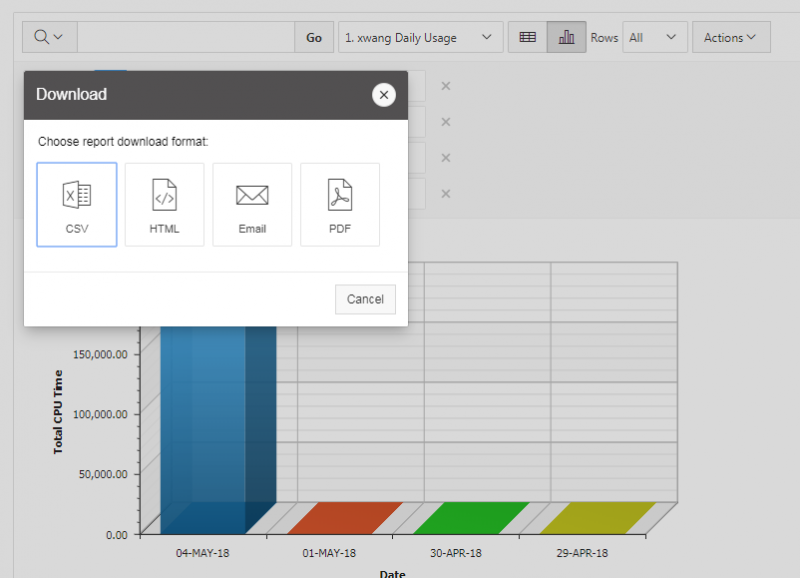
- Click the icon of CSV, HTML, or PDF to download this report, or click the icon of Email to email this report to the desired recipient. Please note the downloaded report is in the format of table only, while other formats like ‘Chart’ won’t be available for downloading.
OnDemand
OnDemand is our "one-stop shop" for access to our High Performance Computing resources. With OnDemand, you can upload and download files; create, edit, submit, and monitor jobs; run GUI applications; and connect via SSH, all via a web broswer, with no client software to install and configure.
We've created a brief video explaining OnDemand's capabilities so users can better gauge if it is the right fit for them. Getting connected to OnDemand is also covered in this video. In addition, we've developed tutorial videos for OnDemand's job client and file management client.
System Requirements
Currently, the site is confirmed to work with newer versions of Chrome (87+), Firefox (87+), and Internet Explorer (11+). We are still working to expand availability to additional clients and are planning on including compatibility for mobile devices (phones and tablets) in the future.
Connecting
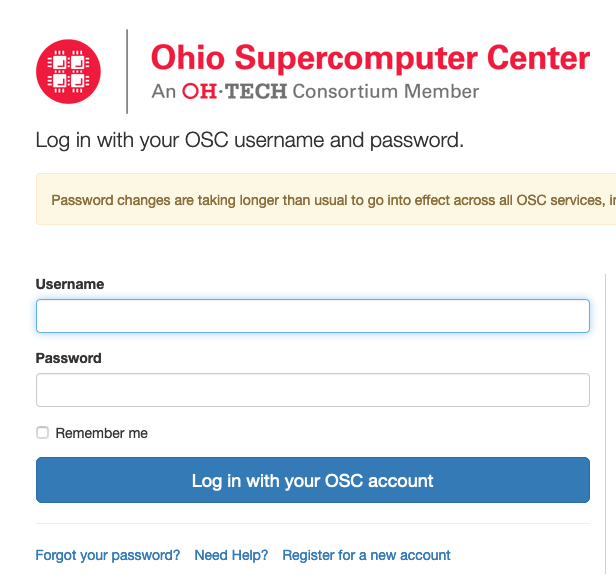
To connect to OnDemand, visit https://ondemand.osc.edu. The first page of the OnDemand site displays instructions on how to log in to OSC OnDemand, which are shown in the image below:
There are two options for logging in.
Option 1: Using OSC HPC Credentials
Follow the steps below to use OSC HPC credentials to directly log in.
Option 2: Using Third-Party Credentials
You can also map third-party credentials to an OSC account and log in using the third-party credentials.

Click the button labeled "Log in with third party though CILogon" at the bottom to continue to step 1 shown below:
- Step 1 requires you to choose an identity provider to log in with. This can be any institute you're affiliated with or even services like Google.
If you check "Remember this selection" you will need to delete cookies from the cilogon domain to make a new choice. You can do this through your browser's settings or at https://cilogon.org/me - Step 2 has you log in using your credentials for the provider you picked.
- Step 3 has you log in with your OSC credentials in order to link your identity provider to your OSC account.
https://idp.osc.edu/realms/osc/account/identity
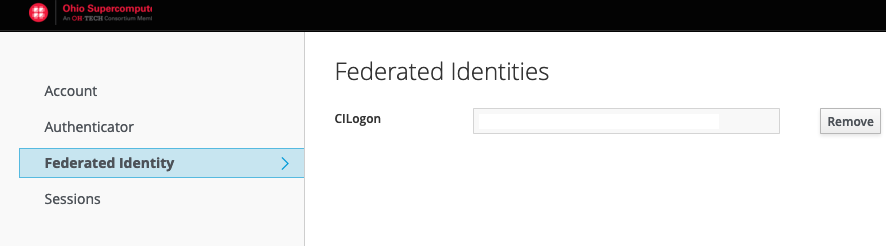
and clicking Remove.
Once completed you will be presented with this page:

Or this page if your browser window is more compact:

The three-lined icon to the right of the compact page expands when clicked to show the full toolbar that the non-compact page has. At this point, you can begin accessing the tools in OnDemand.
File Transfer
Move data on and off of OSC storage services. To use the file transfer client, select "Files" in the main menu. For more information, please visit the file transfer and management page.
Job Management
Create, edit, submit, and monitor jobs. To access the job management tools, use the "Jobs" menu. For more information about the tools, please visit the job management page.

Shell Access
OnDemand provides the ability to SSH to Pitzer, Cardinal, or Ascend from inside your web browser. To get to a terminal, select the "Clusters" menu and choose either Pitzer, Cardinal, or Ascend.
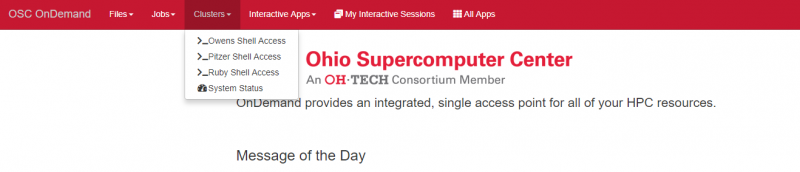
Please note that this action will open a new tab with shell access to the cluster.
System Status
System status can be accessed by clicking on the "Clusters" tab and selecting "System Status" on the drop-down menu. This page shows the current status of the entire system (nodes in use, cores in use, and number of running, queued, and blocked jobs).
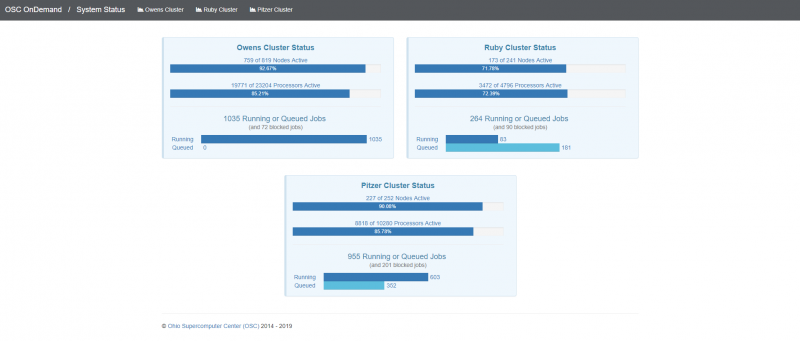
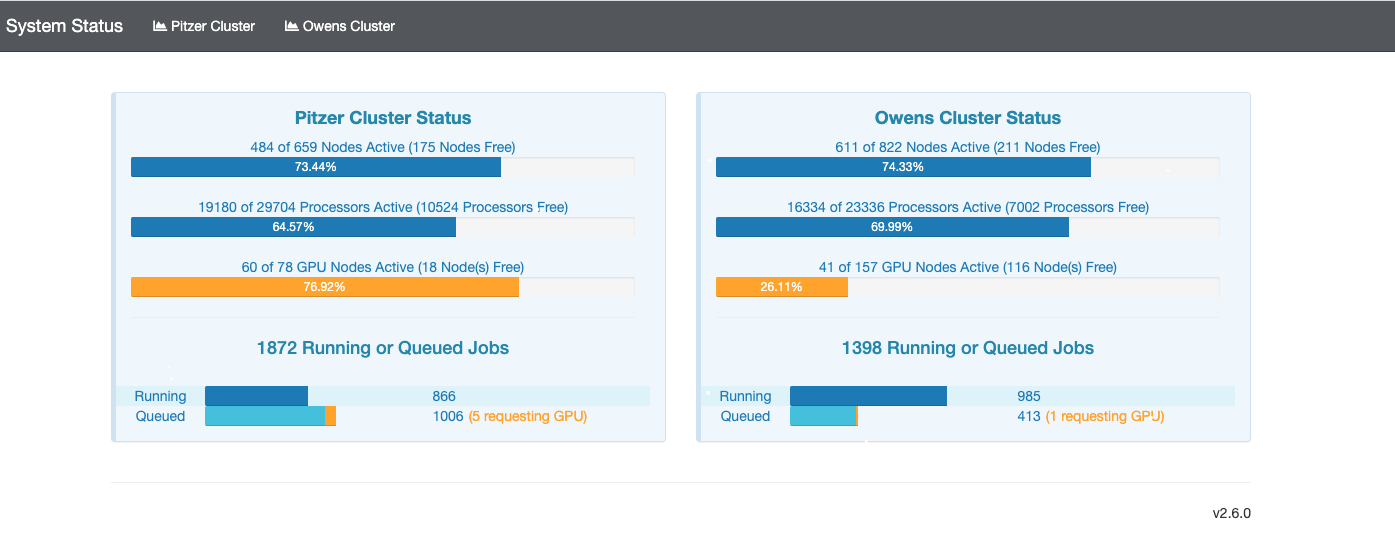
If you click the image, you'll get a detailed report including the total system load, the CPU usage, the total cluster memory use, and the total network traffic on the cluster. The "CPU Report" showing less than 100% use means that there are some cores not currently being used by a job, but that doesn't necessarily mean that they are available to be scheduled. There may be a system reservation that is preventing the scheduler from utilizing all of those cores.
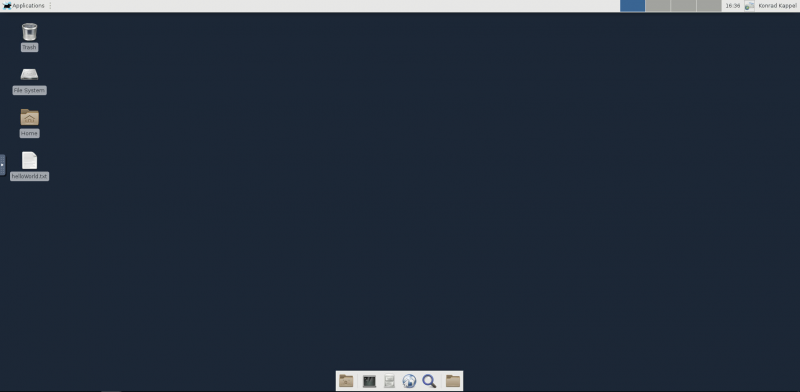
Get a Virtual Desktop
Request a desktop to run GUI applications without the hassle or performance problems associated with X11 forwarding. To access one, please select either "Interactive HPC" or "Virtual Desktop Interface" from the "Desktops" menu.
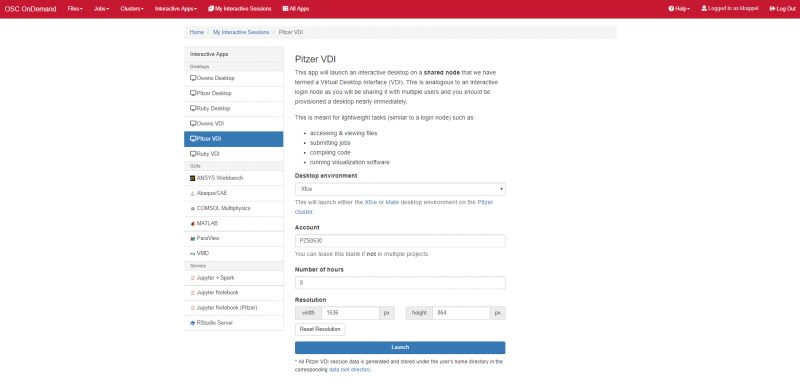
Virtual Desktop Interface
Select one VDI app and you will arrive on the page shown below. Please modify the resolution information if needed and click "Launch." You may need to wait for a few minutes for the interface to launch.
Once the interface is ready to be used, your session manager will have a job that looks like the image below:
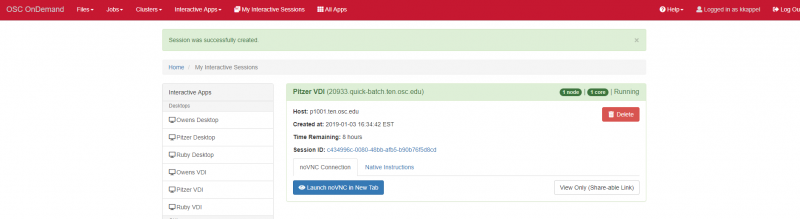
To access the interface, you can choose from "noVNC Instructions" or "Native Client Instructions." If you use "noVNC," you can choose from "Launch noVNC in New Tab" to get your desktop shown below and work accordingly, or "View Only (Shareable Link)" to get your desktop or share your desktop with colleagues in "View Only" mode. If you use "Native Client Instructions", see this page for more information on how to use OSC Connect.
Interactive HPC
Request a desktop on compute node through the batch system without the hassle or performance problems associated with X11 forwarding. To access one, please select "Pitzer Desktop" or others under "Interactive" from the "Desktops" menu.
If you choose "Pitzer Desktop," you will arrive on the page shown below. Please enter the information as desired and click "Launch." You may need to wait for a few minutes for the interface to launch. If you'd like to recieve an email notifiying you of when the interface has launched, please select "I would like to recieve an email when the session starts."

Once the interface is ready to be used, your session manager will have a job that looks like the image below:
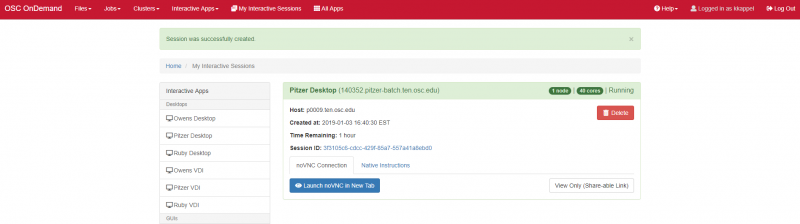
Similarly, you can choose from "noVNC Instructions" or "Native Client Instructions" to get the interface. If you use "noVNC," you can choose from "Launch noVNC in New Tab" to get your desktop and work accordingly, or "View Only (Shareable Link)" to get your desktop or share your desktop with colleagues in "View Only" mode. If you use "Native Client Instructions," see this page for more information on how to use OSC Connect.

Access Application on Compute Node
Request an application on compute node through the batch system without the hassle or performance problems associated with X11 forwarding. To access one, please select any app from the "Desktop Apps" menu. See "Desktop App Catalog" for more information.
Support Tickets
The OnDemand dashboard now supports the ability to send a support ticket to our Help Desk system.
To do so from your OnDemand Dashboard, simply go to > Help > Submit Support Ticket and fill in the following fields on the form that comes up:
Username: Logged in user. Username will be added to support ticket body for reference.
Email: Email address for communication regarding this ticket. Only a single email address is supported.
CC: Additional email address to copy onto this ticket. Only a single email address is supported.
Subject: Brief description of the problem.
Expected behavior: Detailed description of what was expected to happen.
Actual behavior: Detailed description of the unintended outcome.
Steps to reproduce: Detailed description of steps that led to the problem.
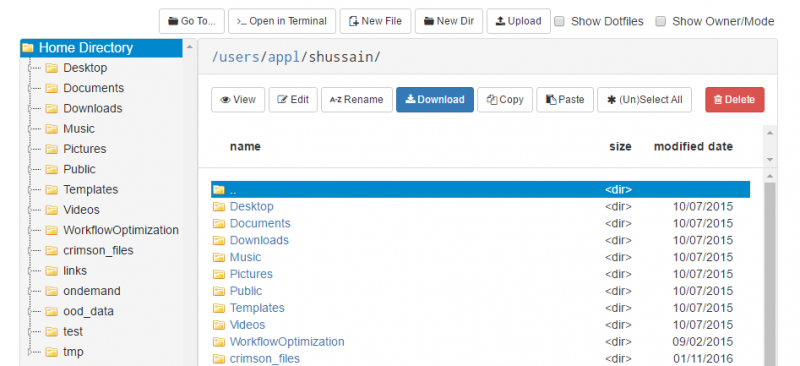
File Transfer and Management
OnDemand provides a web-based File Explorer that can be used to upload and download files to your OSC home directory or project directory, and copy, delete, rename, and edit files.
Here is a tutorial video that gives a overview of OnDemand's file management client's capabilities and how to utilize them.
Here you can see a screen shot of what the main interface looks like.
Navigating
Selecting which File System
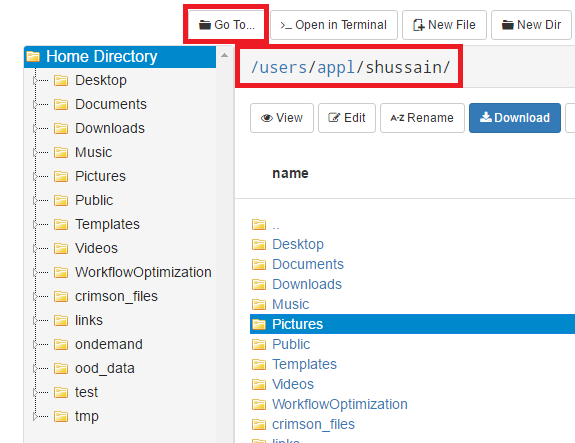
By default, the file browser will be looking at your home directory. If you have access to a project space for GPFS directory, you can switch to those by backtracking through the path near the top of the window and selecting the file system you wish to browse. In addition, you can use the "Go To" option in the top menu to type the path you wish to navigate to. Both the directory path and "Go To" button are highlighted in red in the image above.
Switching Folders
On the left side of the screen is a tree view of the directory structure. You can navigate this tree the same way you might on a normal desktop GUI to select the folder you wish to use.
Uploading and Downloading Files

There are several methods to upload files. The first is to simply navigate to the desired destination, and then drag the file from your local desktop or window navigator to the OnDemand window. You can also click the "Upload" button to open a dialog that will allow you to navigate your local computer and select which files you want to upload. This process is highlighted in the image above.
To download files, you must select the file or files you wish to download, and then use the "Download" button. If you select multiple files ("control+click" or "shift+click") or a folder, the server will zip the files up and download a single zip archive to your desktop machine.
You can also click "Globus" to perform data transfer between OneDrive and other storage via Globus. See this Globus page for general information, and see this OneDrive in Globus on data transfer service with OneDrive.
File Operations
Most file operations can be accomplished by selecting the file in the main window pane and selecting the desired operation from the main menu.
![]()
Viewing and/or Editing a File
The application also includes several built-in file editors. To access these editors and viewers, select the file you wish to view or edit, and select "Edit" from the main menu. This will open up a text editor in a new tab.
Job Management
OnDemand provides two related job managment tools: one allows you to create and submit jobs via your web browser, and the other allows you to monitor queued and running jobs.
Here is a tutorial video that gives an overview of OnDemand's Job client's capabilities and how to utilize them.

My Jobs
Selecting "My Jobs" in the Jobs menu will open an application that allows you to create new jobs and submit them to the cluster, and inspect the results of jobs submitted via this tool.

New Job
Please following the steps in order to create a job:
- Create a new job by copying from an existing job template directory (by clicking "+New Job" button under "Listing Jobs") or a previously run job directory (by clicking "+Copy Job" button under "Listing Jobs").
- If you click the "+New Job" button, you will see the page as below. Select the job template to copy, then click "Create New Job". The template directory will be copied and a new job row will be added to the top of the jobs table on the page titled "Listing Jobs"

- If you click the "+New Job" button, you will see the page as below. Select the job template to copy, then click "Create New Job". The template directory will be copied and a new job row will be added to the top of the jobs table on the page titled "Listing Jobs"
- Select the job, then modify and/or add any files to this job by clicking "Edit Files"
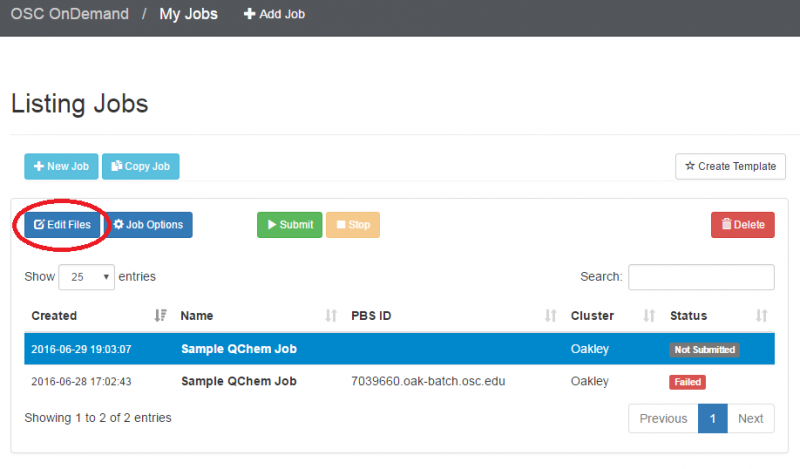
- Select the job and click "Job Options" to change the cluster, job name, or job script, if necessary

- At this point, you can submit the job using the green "submit" button from the "My Jobs" page; or return to this job later to modify it further. You can also monitor the job status here. Currently you must reload the page to see job status changes.
Job Management
On the main screen for "My Jobs" you can click on a job to examine it.
Submit Job
If the job has not been submitted, the "submit job" button will be active, and will submit the selected job to the queue.
Stop Job
The "stop" button will allow you to kill a running job.
Delete Job
The "delete" button will allow you to delete a job
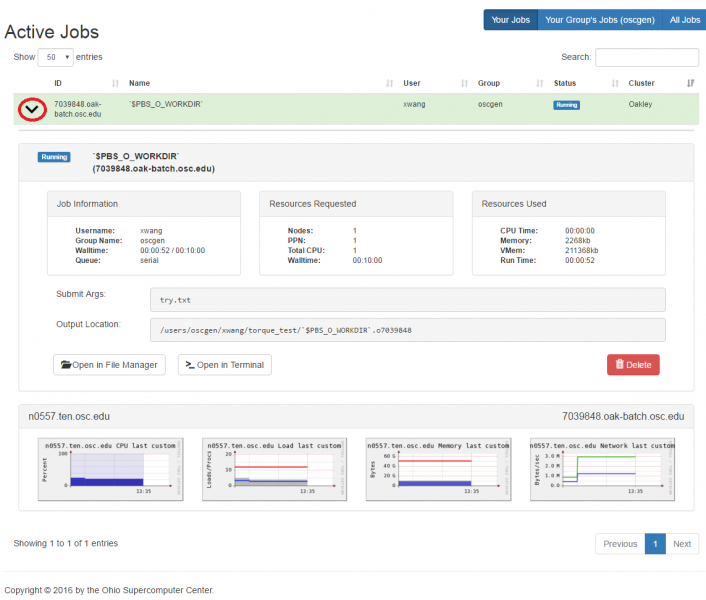
Active Jobs
The "Active Jobs" application will show you all of jobs currently in the queue (running or queued), regardless of how the jobs were submitted. You can click the button on top to switch from:
- All jobs from your OSC account
- All jobs from your project/group
- All jobs from OSC users
You can also use "Search" tool to filter jobs based on sytems (oakley or ruby), status (running, queued, or hold), OSC user accout, etc.

Job Inspection
If you click the arrow to the left of each job you can get more information about this job. It also provides the information of each node on which this job is running on, over the duration of the entire job. Clicking on each image expands it to show more information.