We are going to ask you to look at some data from a watershed and try to figure out how pollution and habitat changes have led to changes in the biology. You can use any of the materials and the websites we showed you as sources of information. You can also ask your teacher or any of the OSC instructors for help if you don't understand something. All of you will do part of the exercise. We will then ask each person in your group to take on a part of the detective work and to present what you find to your group when you are done. Before you start, your teacher will assign you a number between one and four so that you know which part to do.
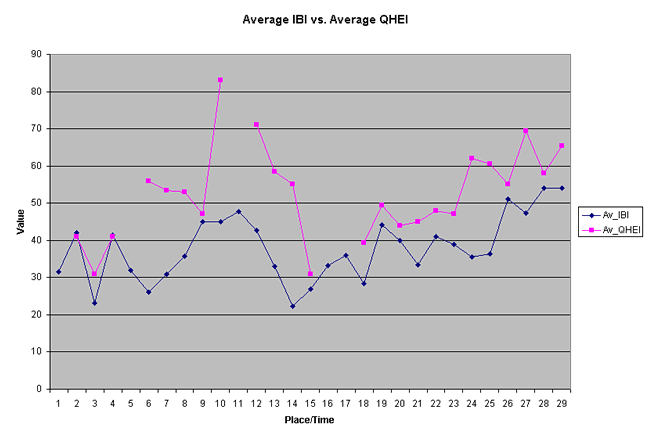
Here is the first part for everyone to do. The graph below and all of the graphs are set up to show you the relationship between pairs of data. In most cases, one of the data items will be one of the biological measures - IBI or ICI - the fish or macroinvertebrates that are impacted by pollution and habitat changes. The other data item is a possible cause of that change. The data items represent samples taken in the watershed over a sampling season - mostly the summer. They were taken at different places so we divided the watershed into small parts and have reported the data so that each line represents a single year summary and one part of the watershed. The data were taken at several times over the season so that we summarize the information by providing the average, maximum, and minimum values for each variable.
Here is the graph for average IBI versus average QHEI. Study it and answer the questions on the next page.