What is Happening in Your Watershed?
As watershed detectives, you looked for patterns that indicated cause and effect relationships. In order to “prove” scientifically that there is a cause and effect relationship, we want to make sure that the relationship is almost always true. Because we are studying watersheds where many things happen at one time, where there are many causes and many effects, this is sometimes very difficult.
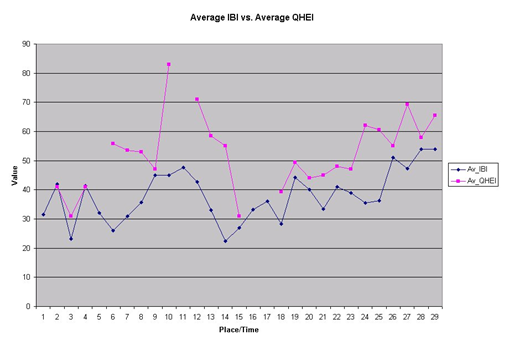
Look at the graph below. It appears that at most times and most places, when QHEI goes up, IBI also goes up and when QHEI goes down, IBI also goes down. We might hypothesize that this is true because good habitat should allow for a better fish population. For the 29 observations in the diagram below, count how many times/places where this is true, how many times it is not true, and how many times where there are no data.
Based on what you found, should we accept our hypothesis that better QHEI results in better IBI? Why or why not?
For the places where it is not true, what else could be happening? What would cause fish diversity to go down even if there is good habitat? How would we look for other evidence associated with the places and times where the other hypothesis did not hold?
