As people use the land for agriculture, to build houses, roads, and industry, they also create major changes in the amount of water that reaches local streams and the quality of that water. Those changes have been observed in many streams. They have also been simulated with computers. We have used the Hellbranch Creek watershed in Central Ohio to illustrate what happens to a stream as development occurs. We do this by simulating what the watershed was like when it was covered with forest and prairie grasses, hundreds of years ago. We then simulate the changes that occurred as people started to use the land for agriculture, then converted some of that agriculatural land to roads, housing, parking lots, and stores.
As a reminder of what happens as land use changes, study the diagram of the hydrologic cycle below. As precipitation occurs over an area with forest and natural vegetation, much of that precipitation is intercepted by the leaves and stems of the plants and absorbed on the surface as surface detention so that it can slowly infiltrate into the soil. When vegetation is removed to create farmland, the amount of interception goes down because farm crops are less effective at intercepting rainfall and do not cover the fields year round. Because of this, more of the precipitation becomes runoff and flows directly into the stream in higher volume and sooner than it did when the land was covered with forest.
This problem becomes worse as urban development occurs. Roads are built with pavement that is impervious to water (water cannot flow through it to the soil) and often is steered into storm drains that speed the water toward the stream. The more intense the development, the more land area is covered with pavement and rooftops, decreasing interception, infiltration, and surface detention. Shopping centers and industry have large parking areas that are paved and drained through storm sewers directly to the stream.

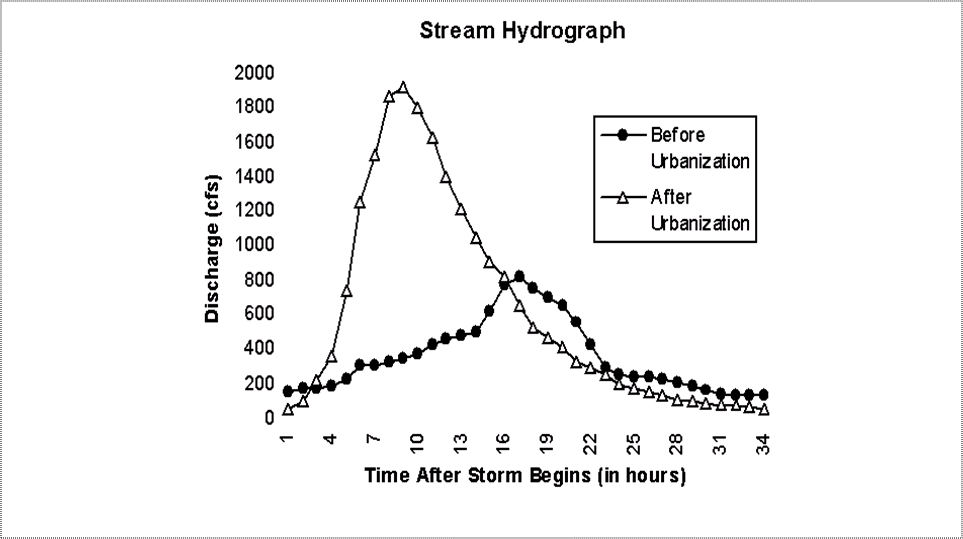
One way to illustrate the impact of the changes on the stream is to create a graph of the flow of the stream over time during a rainstorm. This kind of graph is called a hydrograph. It has the amount of streamflow or runoff called discharge along the Y axis and time along the X axis. The illustration above shows that for the same storm, a watershed after urbanization will have much more runoff occurring in a shorter time period. If the amount of runoff exceeds the capacity of the stream to carry it, flooding will occur.
