he graphs of pollution levels associated with the land use are all like the one shown below. They compare the amount of each pollutant that will move with the stormwater into the stream. The amounts can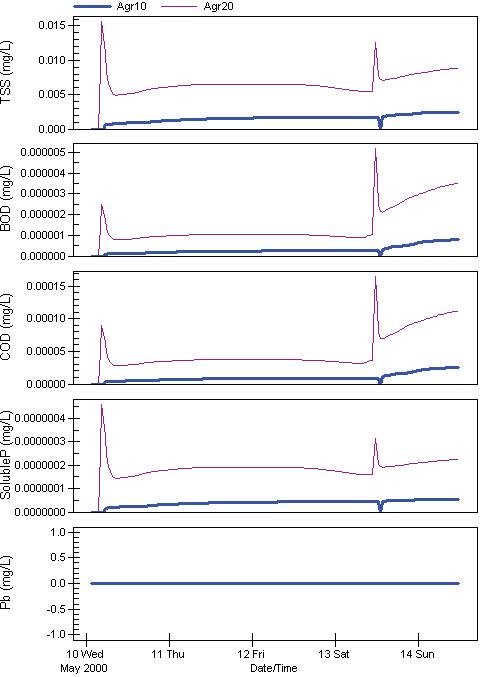 be compared to the fact that no pollutants reach the stream when there is forest. A comparison can also be made between different scenarios. For example, this graph shows that the peak amount of total suspended solids (TSS) for the Agr10 scenario is about 0.002 milligrams/liter (mg/l) while that for Agr20 is about 0.015 mg/l, more than 7 times the amount. Agr10 stands for the scenario where 10% of the land is converted from forest to agriculture and Agr20 stands for 20% of the land converted from forest to agriculture. The exact distribution of the land use changes is shown in the table where you picked a scenario. The definition for the pollutants can be found in various places. Here are some pointers:
TSS
BOD
COD
Phosphorous
Sediments pose several problems including making the water cloudy so that fish may not be able to see their prey, clogging the systems of filter feeding organisms such as mollusks (e.g. clams), and covering the bottom of the stream destroying the habitats for macroinvertebrates.
BOD and COD cause the lowering of oxygen levels in the stream as bacteria consume the organic and chemical wastes. This reduces the oxygen available for all other organisms in the water. BOD storm loads that are not controlled in urban areas can have BOD levels equivalent to dropping 100% of the raw sewage from a community into the stream.
Phosphorous causes the excess growth of algae or eutrophication. This in turn causes wide swings in the oxygen levels of the stream and an unhealthy mass of algae covering the stream surface.
Lead is one of many heavy metals that are poisonous to plants and animals in the stream. Lead levels of 408 micrograms.liter (1/1000 of a gram or 1/100 of a milligram) are considered above standards in Ohio.