We are going to show you several kinds of information from the modeling effort. First, you will choose a "scenario" or model experiment where you pick the kind of land use you are interested in and the amount of that land use change to be simulated. The choices will be shown in a table that shows the percentage of land use of that type overall and how it is distributed around the watershed in the simulation model. After you make this choice you will a set of graphs representing the flow of water associated with the storm discussed earlier.
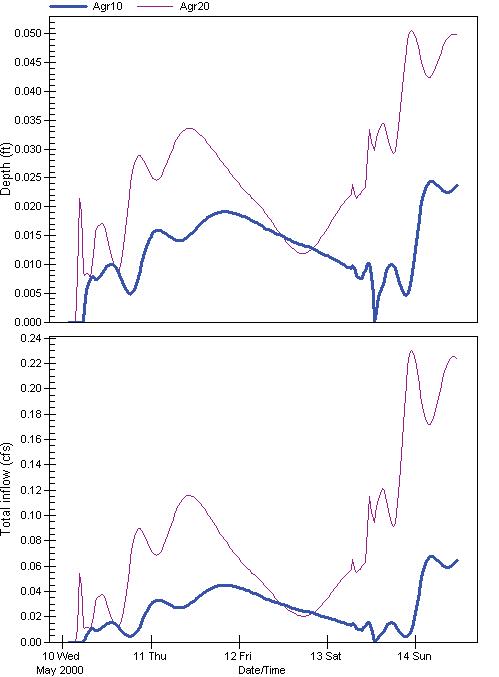
We will then ask you to analyze the flow of water from a sample storm. Storms of this size will occur several times per year and would not cause flooding if the area remains only partially developed. You will be looking at several important factors. You will be shown an example graph like the ones on the left. The top graph shows the depth of flow of the Hellbranch at its mouth (the end of the stream where it meets the Big Darby Creek). The depth is important because it is used to test whether the amount of water flowing down the stream exceeds the capacity of the streambanks. If it does, a flood will occur. The model uses that data to create an animation of the water flow. The animation shows the water level in the stream for the upper part of the stream that is most prone to flooding. If the blue stream level goes above the capacity of the channel, a red dot appears at the place(s) where a flood will occur. You will play that animation later. For now, you only need to analyze the graphs. The graphs show at least two simulations so that you can compare the choice you made with the least amount of that land use. The one shown compares the 10% and 20% agricultural land use (labelled as Agr10 and Agr20). You wil be asked to record the highest level for each of the scenarios you analyze. In this case you would read 0.024 feet (or 0.29 inches) for the Agr10 scenario and 0.050 for the Agr20 scenario.
The next thing you will look at is the total inflow. This is the total flow of the stream at the mouth measured in cubic feet per second or cfs. The key things to look for in the Total Inflow graph is what is the peak (highest) amount of flow and what is the area under the graph. The peak flow is another indication of whether or not there will be a flood and also reflects the changes in the balance of the hydrologic cycle from interception and infiltration to runoff. The area under the graph shows the amount of total runoff that occurred because of the storm. The units are in cubic feet per second or CFS. One CFS represents a flow of 646,317 gallons per day or 7.48 gallons per second of flow.
<--Sample Hydrographs showing the depth of flow (top) and total amount of flow at the mouth of the Hellbranch.
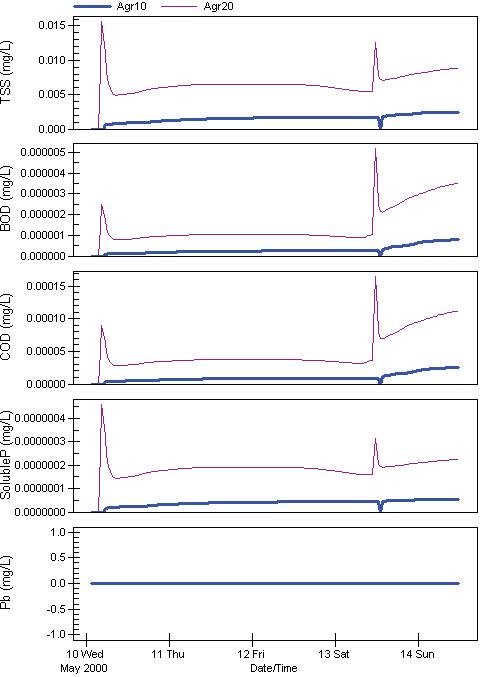
 The next graphs you will be shown are pollution graphs. The graph on the left shows the amount of pollution over time that flows to the stream with the stormwater for five different water pollution types. The one shown also compares the two scenarios for Total Suspended Solids (TSS), Biochemical Oxygen Demand (BOD), Chemical Oxygen Demand (COD), soluble phosphorus (SolubleP), and lead (Pb). You can fine definitions of these water quality variables on this page. Notice that no lead is forecast to come from the agricultural land uses. Both the peak and total amounts of pollutants are important. Notice that those numbers are in concentrations. The concentrations can be compared with the standards and guidelines relating to these pollutants you can find in the help files.
Now choose one of four activities by using the numbers below. If you need help, there will be a help menu on the subsequent screens that describes how to analyze the data you will see.
 Agricultural Land Uses
 Low Density Urban Land Uses
 Medium Density Urban Land Uses
 High Density Urban Land Uses
Sample pollutographs showing the amount of pollution of different types that comes into the stream with the stormwater
