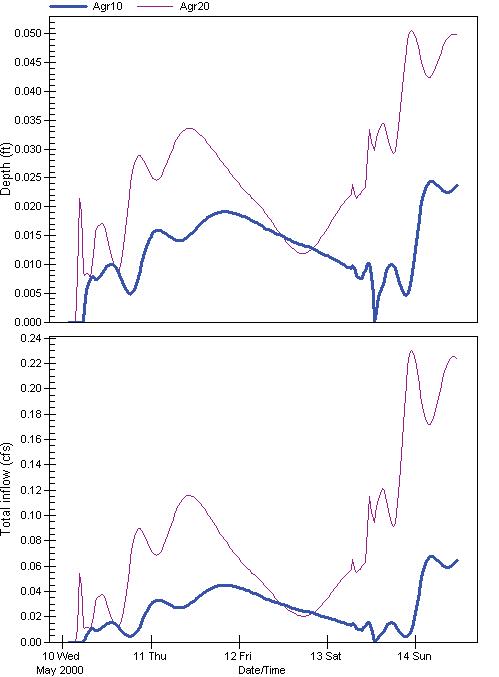
There are two graphs that are shown for each scenario. The first one shows the depth of the flow in the channel near the outlet or mouth of the stream. The actual depth of the stream at this location is about six feet. However, it is much shallower upstream - only three to four feet - so a storm that produces a depth above those levels could cause a flood. You can look at the highest point on this graph to see how close it is to a flood at this place from these storms and to compare the depths between different land use scenarios. On this graph, the 10% and 20% agriculture scenarios produce a maximum depth of 0.025 and 0.50 feet respectively - well below flood level. However, it is clear that changing from forest (that produced no runoff) and from 10 to 20 percent agriculture, there was a major change in the depth.
Similarly, the bottom graph shows the amount of runoff represented as inflow of water at the mouth in cubic feet per second. The graphs also show the total amount of runoff that occurred in response to the same storm. The peak runoff from 10% agriculture is .07 cfs while that from 20% is 0.23 cfs - more than triple the amount.